Introduction
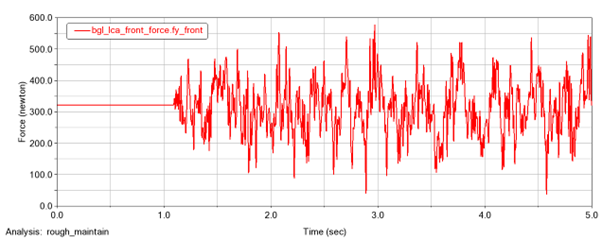
The Rainflow counting method is used to quantify the magnitude and count of loading cycles in a complex load-time history. The number of cycles at different mean values and the corresponding min/max ranges of the cycles can be used to estimate fatigue damage in a component. A typical load-time history from a durability analysis, for example, contains many finely-spaced outputs having varying frequency content. A portion of such an analysis might appear like so:
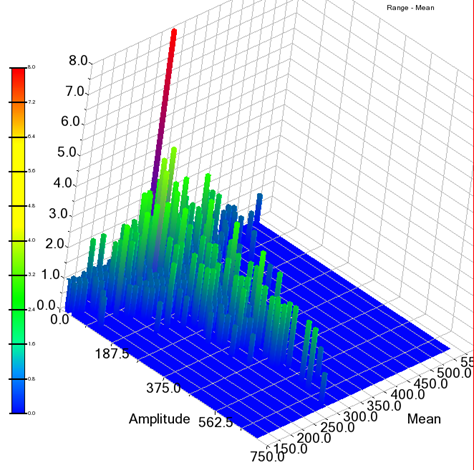
The ’four point method’ is used to count loading cycles within this complex signal. This data can show the number of cycles as a function of the cycle mean and amplitude, as shown below:
The following plot types can be created using the Rainflow Plotting dialog box:
■Rainflow Histogram as a function of cycle amplitude and mean value,
■Rainflow Histogram as a function of cycle start and end values,
■Range Pairs - the number of cycles as a function of cycle amplitude,
■Cumulative Range Pairs - a cumulative form of the data above,
■Level Crossings - range amplitudes as a function of the number of cycles,
■Equivalent Load & Damage - typically used if the time history represents stress in the material but if the relationship between loads and stress is understood then this may also be applied to load histories.