plot3D surface create/modify
Allows you to create/modify a three dimensional surface plot.
A three dimensional surface plot can be created in a plot window in a page within the postprocessor window. The 'interface plot window open' command can be used to create a new plot window where a page can be created to display the three-dimension surface plot.
Format:
plot3d surface create or modify | |
|---|---|
surface_name = | a new plot3d surface or an existing plot3d surface |
x_data = | real |
y_data = | real |
z_data = | real |
x_units = | string |
y_units = | string |
z_units = | string |
skip_x = | integer |
skip_y = | integer |
use_interpolated_colors = | true_only |
color = | an existing color |
Example:
plot3D surface create & or modify & | |
|---|---|
surface_name = | dome_surf & |
x_data = | 1 & |
y_data = | 1 & |
z_data = | 1 & |
x_units = | force & |
y_units = | force & |
z_units = | pressure & |
skip_x = | 1 & |
skip_y = | 1 & |
color = | BLUE |
Description:
Parameter | Value Type | Description |
|---|---|---|
surface_name | A new plot3d surface | Specifies the name of a 3D surface plot to be created |
x_data | Array of real values | Specifies the values of the x axis. Example: 1,2,3 or expression as (.MODEL_1.Sim_001.TIME) |
y_data | Array of real values | Specifies the values of the y axis. Example: 1,2,3 or expression as (.MODEL_1.Sim_001.TIME) |
z_data | Array of real values | Specifies the values of z at each x,y value. |
x_analysis | Array of analyses | Specifies analyses on x-axis, to be used for z data comparison. Example. Sim_001, Sim_002, Sim_003 |
y_analysis | Array of analyses | Specifies analyses on y-axis, to be used for z data comparison. Example. Sim_001, Sim_002, Sim_003 |
z_components | Single/Array result components | Specifies result component(s) to be used for z data. Example: In case of different analysis, Z component data will be fetched from input analyses. Z data component can be specific component also, if not used in combination with analyses. |
color_components | Single/Array result components | Specifies result component(s) to be used for color data. Example: In case of different analysis, color component data will be fetched from input analyses. Color data component can be specific component also, if not used in combination with analyses. |
stacked_curves | Boolean, yes/no | Creates a set of 2D curves stacked in 3D space instead of a surface. |
x_units, y_units, z_units | String, Units for x, y, z data | Specifies the units. |
skip_x, skip_y | Integer | Specifies the x/y increment values to skip. |
color | Boolean | Specifies a single color with which to display the color. |
Examples:
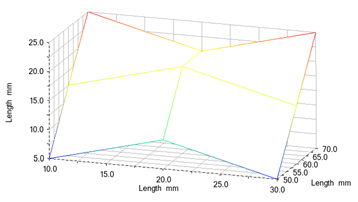
1. Surface Creation with Data Values
plot3d surface create surface_name = surface3d__1 x_data = 10,20,30 y_data = 50,60,70 z_data = 5,10,5,15,20,15,25,20,25 x_units = mm y_units = mm z_units = mm
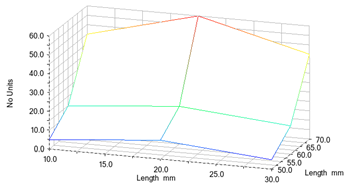
2. Surface Modification with Data Values
plot3d surface modify surface_name = surface3d__1 z_data = 5,10,5,15,20,15,45,60,45
Similarly, x_data and/or y_data can also be modified to modify the created surface.
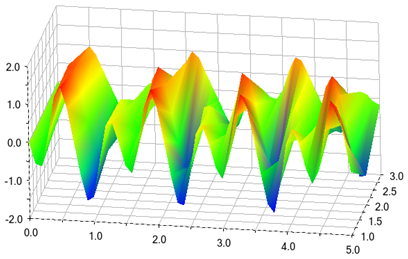
3. Surface Plotting a Common Output Channel across Multiple Analyses
plot3d surface create surface_name = surface3d__2 y_analysis = Sim_001, Sim_002, Sim_003 x_data = (.MODEL_1.Sim_001.TIME) z_components = .MODEL_1.Sim_001.PART_2_XFORM.PSI
4. Modification of Surface's Z Parameter
plot3d surface modify surface_name = surface3d__2 z_components = .MODEL_1.Sim_001.PART_2_XFORM.X
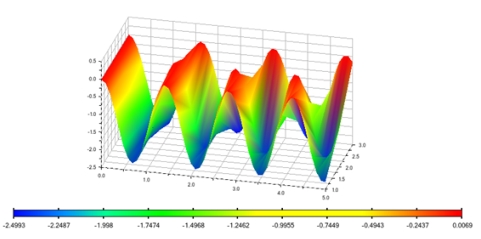
5. Use of Color Component as 4th Dimension to 3D Plots
plot3d surface create surface_name = surface3d__2 y_analysis = Sim_001, Sim_002, Sim_003 x_data = (.MODEL_1.Sim_001.TIME) z_components = .MODEL_1.Sim_001.PART_2_XFORM.VX color_components = .MODEL_1.Sim_001.PART_2_XFORM.VY
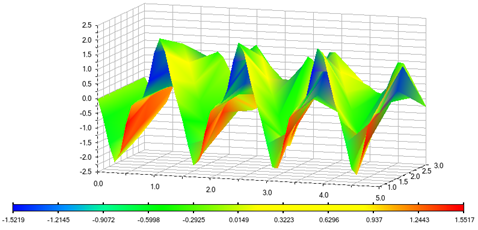
In case, when input is color_components, color values shown in 3D Plot is derived from color_component.
Legend will display color and values corresponding to color input in this case.
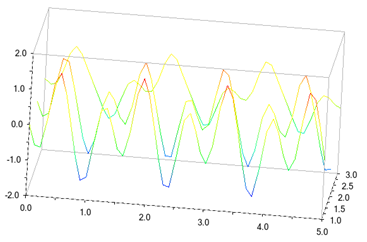
6. Stacked Plots Generation
plot3d surface create surface_name = surface3d__2 y_analysis = Sim_001, Sim_002, Sim_003 x_data = (.MODEL_1.Sim_001.TIME) z_components = .MODEL_1.Sim_001.PART_2_XFORM.VY stacked_curves = yes
7. Modification from Stacked Plot to Surface Plot
plot3d surface modify surface_name = surface3d__2 stacked_curves = no
Extended Definition:
1. The name of the surface plot to be created is specified initially.
2. Rule of thumb for successful surface generation is as follows:
Number of Z/Color values = Number of X*Y values.
3. The data values of x, y and z data are entered, where the upper and lower limits of the respective axis can be specified explicitly. If not specified, the upper and lower limits on each axis will be datum value ±1.
4. The units of x, y and z axis are specified by entering the 'units' for respective axes. The units can be entered as default units, for example, for force enter 'newton'. Alternatively, you can enter unit as 'force' which will display the default unit for force on the surface plot.
5. Set the x and y increment values you want Adams PostProcessor to skip. Setting it to 1 for each creates the smoothest surface.
6. The parameter 'use_interpolated_colors' is set to 'true' to display the surface of the plot as a range of colors. A legend explaining the colors and the values they represent appears. Alternatively, the 'color' is set to any single color with which to display the surface.
7. Analyses can be plotted along the X or Y axis only, and never along both at the same time.
8. When an axis is defined by multiple analyses, those analyses must have the same set of values for time (that is, both the start and end range and the sampling rate(s) must be identical).