xy_plots template zoom
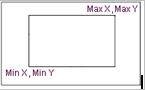
Allows you to set the horizontal and vertical axis limits of a plot by selecting a rectangular region of a plot.
The region defined by the zoom rectangle will be used to set the new axis limits. This allows you to blow up or focus in on areas of interest on the plot.
Format:
xy_plots template zoom | |
|---|---|
plot_name = | existing plot |
x_graph_min = | real |
x_graph_max = | real |
y_graph_min = | real |
y_graph_max = | real |
Example:
xy_plots template zoom & | |
|---|---|
plot_name = | plot_1 & |
x_graph_min = | 200 & |
x_graph_max = | 280 & |
y_graph_min = | 100 & |
y_graph_max = | 150 |
Description:
Parameter | Value Type | Description |
|---|---|---|
plot_name | Existing Plot | Specifies a string of characters that identifies one or more existing plots. |
x_graph_min | Real | Right coordinate of zoom region. |
x_graph_max | Real | Left coordinate of zoom region. |
y_graph_min | Real | Bottom coordinate of zoom region. |
y_graph_max | Real | Top coordinate of zoom region. |
Extended Definition:
Minimum and Maximum Values for Zoom Region