Comparing the Analysis Results
You now create a plot that compares the analysis results from the baseline suspension and steering assembly with the analysis results from the modified suspension and steering assembly.
To compare the analysis results:
1. Press F8 to launch Adams PostProcessor.
2. From the Plot menu, select Create Plots.
3. In the Plot Configuration File text box, enter mdids://private/plot_configs.tbl/brake_pull.plt.
4. In the Plot Title text box, enter Brake Pull Analysis - UAN_FRT_SUSP.
5. To plot the results of the two analyses on one page, select Cross Plotting.
6. Select OK.
7. Use the plot navigation tools to cycle through the plots.
8. Focus on the plot of the Steering Wheel Torque vs Steering Wheel Angle, shown in the following figure. It contains values for both the baseline and the modified suspension and steering assembly. Notice that the pull is reduced for all steering wheel angles, as expected.
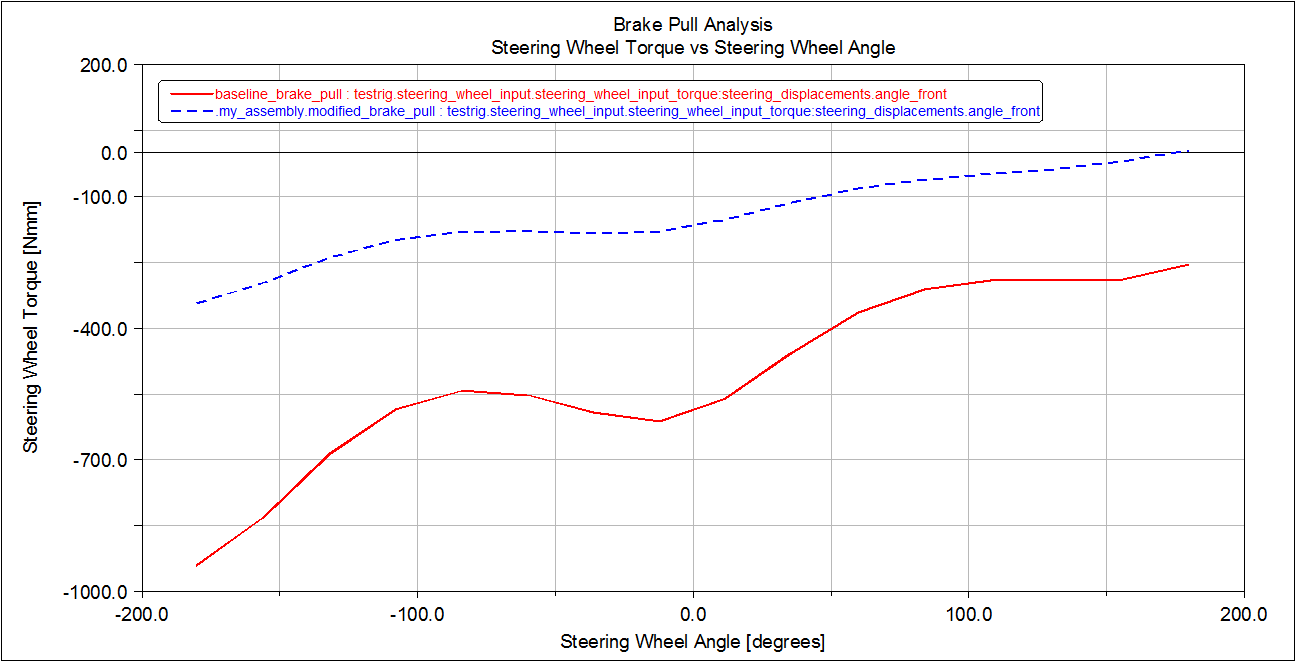
Figure 6 Comparison Plot for Steering Wheel Torque vs Steering Wheel Angle
9. Cycle through the plots until you see a plot of the Scrub Radius vs Steering Wheel Angle, shown below. This plot also contains values for both the baseline and the modified suspension and steering assembly. Notice that the scrub radius decreased from 34 mm to about 9 mm because of the suspension modifications.
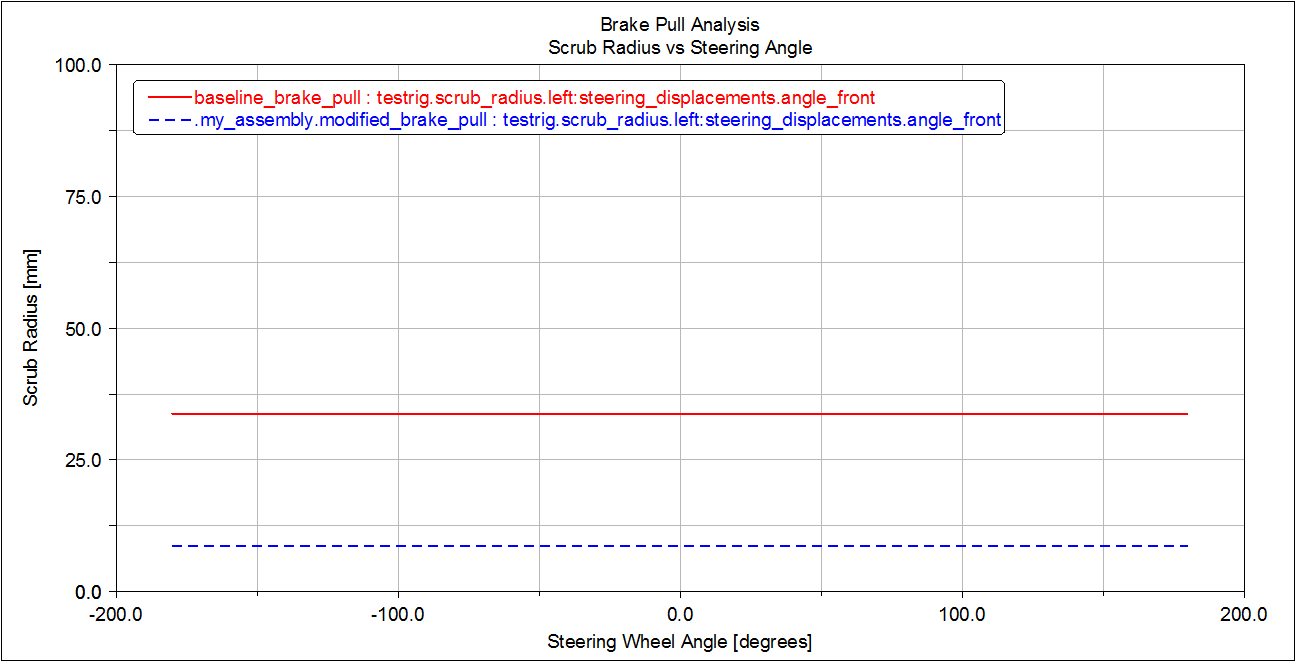
Figure 7 Comparison Plot for Scrub Radius versus Steering Wheel Angle