Reviewing Tabular Results
In this section, you will review tabular results of the vibration analysis you just performed.
To view the table of eigenvalues:
1. Click the Plugins tab on the Adams View ribbon.
2. From the Vibration container, click Vibration tool  → Review → Display Eigenvalue Table.
→ Review → Display Eigenvalue Table. The following table appears:
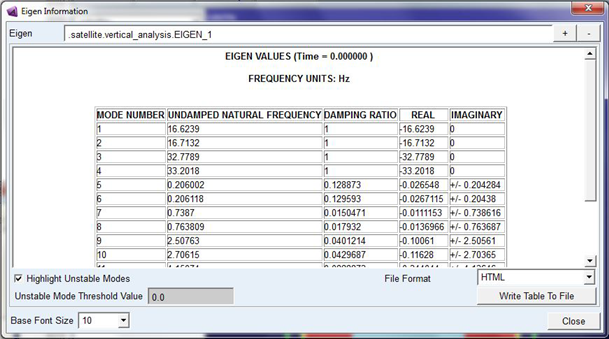
Note that all modes of the model are stable. If the model had unstable modes, they would be highlighted in the table. If you had performed multiple vibration analyses, you could use the +/- buttons in the top right corner of the window to navigate between eigenvalue tables of successive analyses.
3. Select Close to close this table.
To view the table of modal coordinates:
1. Click the Plugins tab on the Adams View ribbon.
2. From the Vibration container, click Vibration tool → Review → Display Modal Info Table.
→ Review → Display Modal Info Table. The following table of model coordinates at 0.1 Hz excitation appears:
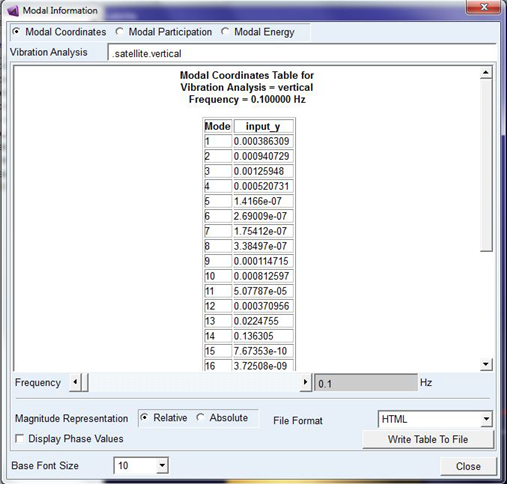
This table displays how much the 28 modes in this model are excited at this forcing frequency for input input_y. You can review the modal coordinates at different excitation frequencies using the Frequency slider.
3. Select Modal Participation to display the modal participation table in the analysis.
4. Select Modal Energy to display the modal energy distribution table.
5. Select Close to complete your review of the Modal Info tables.