Animating a Forced Vibration Analysis
Next you animate the mode to inspect the system response to a forced vibration of 2.5 Hz, a frequency close to the eigenvalue of system mode 9.
To view a forced vibration animation:
1. Select Forced Vibration Animation.
2. In the Frequency text box, enter 2.5, and then press Enter.
Adams Vibration automatically selects the closer frequency value for the animation contained in the frequency response analysis (2.5119 Hz).
3. Select Automatically set time fields for one cycle.
Adams Vibration sets the end time and steps for the forced vibration animation so that one cycle is always displayed.
4. Set Scale Factor to 0.0, and then press Enter.
Adams Vibration calculates the scale factor.
5. Select the Play tool.
6. Look at the response.
The satellite’s vertical motion is the main contributor to the vibration at this frequency.
7. In the Frequency text box, enter 10 and then press Enter.
Adams Vibration automatically selects the closer frequency value for the animation contained in the frequency response analysis (10 Hz). This shows an amplification of the frequency response.
8. Select the Pause tool  .
.
. 9. From the Vibration menu, point to Review, and then select Display Modal Info Table.
10. Select Modal Coordinates.
11. In the Modal Information window, set the Frequency to 10.0 Hz and then press Enter.
The Modal Information window appears as shown in the next figure. Note that mode 15 is the primary contributor to the system response at about 10 Hz.
12. Select Modal Participation and view the information.
This table indicates the level of participation of the systems modes in each of the output channels.
13. Select Modal Energy.
If you opted to compute modal energy at the time the vibration analysis was run, Adams Vibration displays the modal energy information.
The modal energy table displayed corresponds to the mode selected using the mode slider or to the mode number typed in the mode field.
14. Close the Modal Information window.
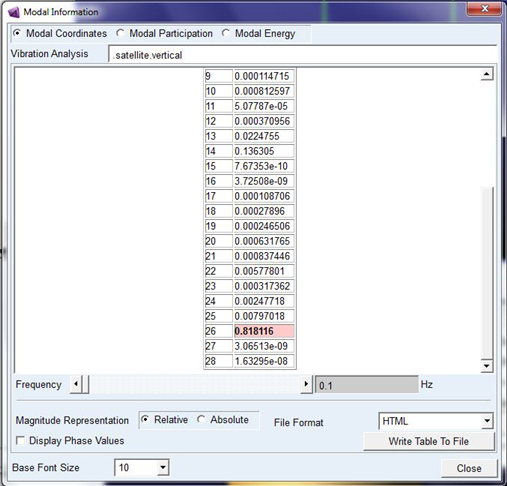
Figure 4 Modal Coordinates Table