Plotting Power Spectral Density
Here you plot the power spectral density, or PSD. This plot shows the transmitted power from all inputs used in your analysis as a function of frequency.
To plot power spectral density:
1. Select the New Page tool.
2. Right-click the Page Layout tool, and then select the Page Layout: 1 View tool  .
.
. 3. Set Source to PSD.
4. From the Vibration Analysis list, select vertical.
5. From the Output Channel list, select p1_corner_y_acc.
6. Select Add Curves.
Adams PostProcessor plots the power spectral density on a logarithmic scale.
7. Select the vertical axis of the plot.
8. Select dB from the list of scale options.
Adams PostProcessor plots the transmitted acceleration in the units of (mm/sec2)2/Hz, as shown in the figure below.
The resonance peak again corresponds to the frequency of about 2.5 Hz, as discussed above.
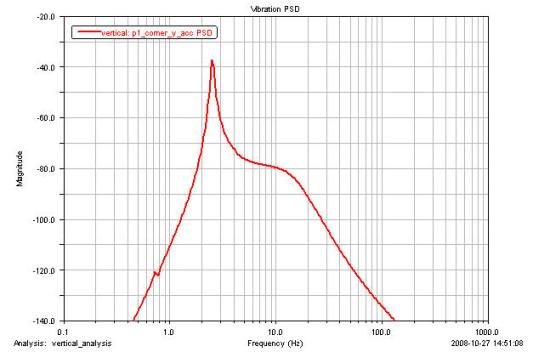
Figure 6 Power Spectral Density Plot