Plotting Modal Coordinates
Here you plot the modal coordinates to find out which modes participate more in the response.
To plot modal coordinates:
1. Select the New Page tool.
2. Set Source to Modal Coordinates.
3. From the Vibration Analysis list, select vertical.
4. From the Input Channels list, select input_y.
5. Set Modal Coordinates By to Mode.
6. Set Mode to 9.
7. Select Add Curves.
Adams PostProcessor plots the modal coordinates.
8. Set Mode to 15.
9. Select Add Curves.
Adams PostProcessor plots the modal coordinates.
In the following graph, note the difference in the two curves to observe which modes are participating more in the response, especially near 2.5 Hz.
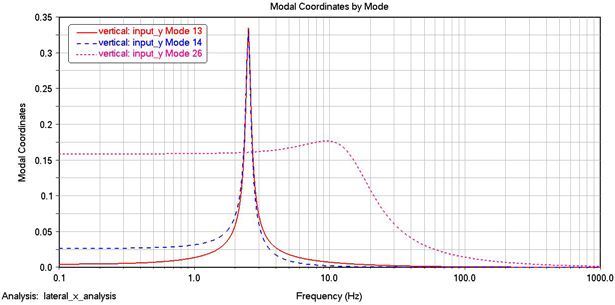
Figure 7 Modal Coordinates Plot