Creating a Plot Using Virtual Test Data
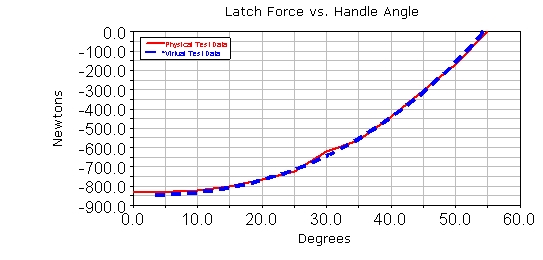
Use the overcenter_angle and the SPRING_1_MEA_1 measures to create a plot of your virtual test data, to use in your comparison. After you examine your plots, you will see that the physical test data is not exactly the same as the virtual test data. The data is in close agreement, however.
To create a plot using virtual test data:
1. In the dashboard, from the Simulation list, select Last_Run (...).
2. Set Independent Axis to Data.
The Independent Axis Browser appears.
Note: | In case the Independent Axis browser does not appear, set the Independent Data to "Time" and then back to "Data". |
3. Select overcenter_angle, for the horizontal axis data.
4. Select OK.
5. From the Measure list, select SPRING_1_MEA_1, for the vertical axis data.
6. Select Add Curves.
7. Change the legend text for this curve (curve_2) to Virtual Test Data.
8. From the File menu, select Close Plot Window.