Running a Design Study
Run a design study to quickly look at a range of design variable values, and see how they affect the design. Adams View gives you the option of displaying various plots, as well as a design study report. The design study report includes the design sensitivity of the pivot location, which is the rate of change of the spring force with respect to a change in the pivot location.
To run a design study:
1. Click the Design Exploration tab on the Adams View ribbon.
2. From the Design Evaluation container, click Design Evaluation tool  .
.
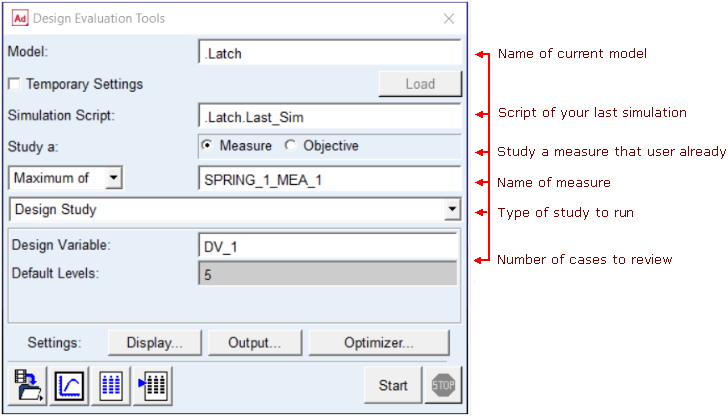
.The Design Evaluation Tools dialog box appears.
3. Fill out the dialog box that appears so it matches the one shown here. Leave the dialog box open.
4. In the Design Evaluation Tools dialog box, select Display.
The Solver Settings dialog box appears.
5. To see all the options, select More.
6. Set Time Delay to 0.0.
7. Set Chart Variables and Show Report to Yes.
8. In the Solver Settings dialog box, select Close.
9. In the Design Evaluation Tools dialog box, select Start.
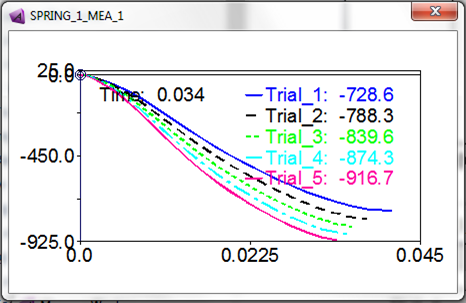
Adams displays the following plots and a design study report:
■Spring force plot, with five curves for the five different cases:
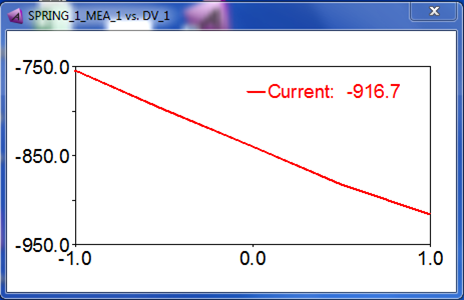
■SPRING_1_force versus DV_1 plot:
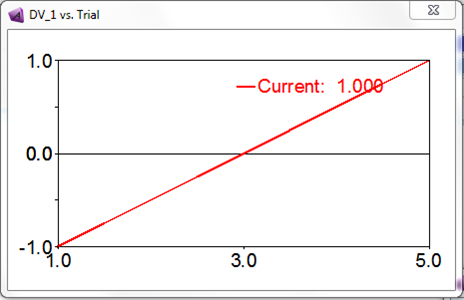
■DV_1 versus Trial plot:
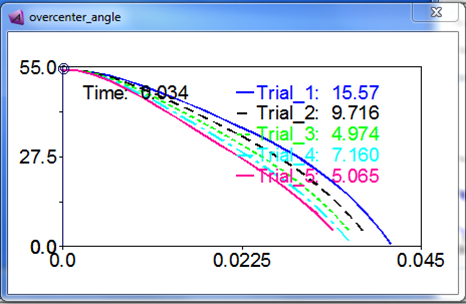
■overcenter_angle plot, with five curves for the five different cases:
■Design study report:
Note: | Your results might vary slightly (about 1%) from those shown here due to computational differences. |
10. Close the Information window, the Message window, and the Design Evaluation Tools dialog box.