Road-Profile Generation Tool
The Adams Car Ride tool for generating road profiles with roughness uses a mathematical model developed by Sayers [1, 2]. The model is empirical: it is based on the observed characteristics of many measured profiles of roads of various types. The model also provides for the synthesis of profiles for both the left and right wheeltracks.
Learn more about the road-profile generation tool:
About the Road-Profile Generation Tool
For a single wheeltrack, the model assumes that the power-spectral density (PSD) of the displacement (elevation) of a road profile,  , is a function of wavenumber,
  , given by the equation:
, is a function of wavenumber, , given by the equation: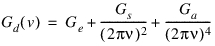 | (4) |
Therefore, it is assumed that roughness comes from three components. Each is obtained from an independent source of white noise, that is, random numbers.
■The first component, with amplitude  , is white-noise elevation.
, is white-noise elevation. ■The second, with amplitude  , is white-noise slope (velocity) that is integrated once with respect to time.
, is white-noise slope (velocity) that is integrated once with respect to time.■The third, with amplitude  , is white-noise acceleration that is integrated twice with respect to time.
, is white-noise acceleration that is integrated twice with respect to time.The letter  above denotes Gaussian. Each sequence of random numbers is assumed to have a Gaussian distribution with a mean value of zero and a standard deviation,
  , of:
, of:
above denotes Gaussian. Each sequence of random numbers is assumed to have a Gaussian distribution with a mean value of zero and a standard deviation, , of: | (5) |
where:
■ is a white-noise amplitude for one of the three terms in Equation 1 (
 )
)
is a white-noise amplitude for one of the three terms in Equation 1 ()■ is the interval between samples, expressed in the inverse units of those used for wavenumber
is the interval between samples, expressed in the inverse units of those used for wavenumberAs explained in Reference 2, profiles for the left and right wheeltracks are obtained by the following method, which maintains the proper coherence between them:
1. Filtering and summing white-noise sources generates three uncorrelated profiles, as described statistically by the specified wheeltrack PSD, that is, the specified values of  ,
,  , and
, and  . Adams Car Ride scales them such that their PSD amplitudes are half of the wheeltrack PSD. The first of these is designated
  . It is not filtered further. The remaining two profiles are subsequently processed by filtering.
, , and . Adams Car Ride scales them such that their PSD amplitudes are half of the wheeltrack PSD. The first of these is designated . It is not filtered further. The remaining two profiles are subsequently processed by filtering. 2. A cut-off wavenumber,  , is established for the subsequent filtering as:
, is established for the subsequent filtering as:(6)
where  is the correlation baselength. The recommended value for
  is 5.0 (m).
is the correlation baselength. The recommended value for is 5.0 (m). 3. The second uncorrelated profile is filtered with a low-pass filter with cut-off wavenumber  . The resulting profile is designated
  .
.
. The resulting profile is designated . 4. The third uncorrelated profile is filtered with a high-pass filter with cut-off wavenumber  . The resulting profile is designated
  .
.
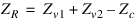
. The resulting profile is designated . 5. The left and right wheeltrack profiles,  and
and  , are then obtained from these three components:
and , are then obtained from these three components:(7)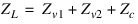
(8)
Parameter Variables for Sayers Roughness Model
Example values for the parameters  ,
,  , and
, and  . are shown in the following table, which is taken from Appendix E of Reference 1. The terms flexible and rigid, as descriptions of surface types, approximately correspond to asphalt and Portland-cement concrete (PCC) roads, respectively. The symbol IRI in the table denotes International Roughness Index, which is a widely used road-roughness standard that was developed with The World Bank. The IRI is discussed in detail in Reference 3.
, , and . are shown in the following table, which is taken from Appendix E of Reference 1. The terms flexible and rigid, as descriptions of surface types, approximately correspond to asphalt and Portland-cement concrete (PCC) roads, respectively. The symbol IRI in the table denotes International Roughness Index, which is a widely used road-roughness standard that was developed with The World Bank. The IRI is discussed in detail in Reference 3.Table 1 Example Parameter Values for the Sayers Roughness Model
IRI | Ge | Gs | Ga | ||
|---|---|---|---|---|---|
Surface type |  |  |  |  |  |
Smooth Flexible | 75 | 1184 | 0 | 6 | 0 |
Flexible | 150 | 2367 | 0 | 12 | 0.17 |
Rough Flexible | 225 | 3551 | 0.003 | 20 | 0.20 |
Smooth Rigid | 80 | 1263 | 0 | 1 | 0 |
Rigid | 161 | 2541 | 0.1 | 20 | 0.25 |
Rough Rigid | 241 | 3804 | 0.1 | 35 | 0.3 |
As explained in Reference 1, the range of values shown for the slope coefficient mainly reflects the roughness range covered by the roads in each category. The other two coefficients describe additional roughness increasing for very short and very long wavelengths. Amplitudes of very long wavelengths, indicated by nonzero values of  , might be associated with the quality of grading performed in building the road. High amplitudes of very short wavelengths, typified by nonzero values of
  , are commonly caused by surface defects that are extremely localized, such as faults, tar strips, and potholes.
, might be associated with the quality of grading performed in building the road. High amplitudes of very short wavelengths, typified by nonzero values of , are commonly caused by surface defects that are extremely localized, such as faults, tar strips, and potholes.Generating a Road Profile
To generate a road profile:
1. From the Ride menu, point to Tools, and then select Road-Profile Generation.
3. Select OK.
References
1. Gillespie, T.D., et.al., "Effects of Heavy-Vehicle Characteristics on Pavement Response and Performance." NCHRP Report 353, Transportation Research Board, Washington D.C., 1993, 126 pp.
2. Sayers, M.W., "Dynamic Terrain Inputs to Predict Structural Integrity of Ground Vehicles." UMTRI Report No. UMTRI-88-16, April 1988, 114 pp.
3. Sayers, M.W. and Karamihas, S.M., "Interpretation of Road Roughness Profile Data." Final Report SPR-2 (159), Federal Highway Administration, Contract No. DTFH 61-92-C00143, January 1996.
4. MTS Systems Corporation: http://www.mts.com/ucm/groups/public/documents/library/mts_007569.pdf or Adams Durability online help: Referencing Test Data