Accessing Rainflow Plots
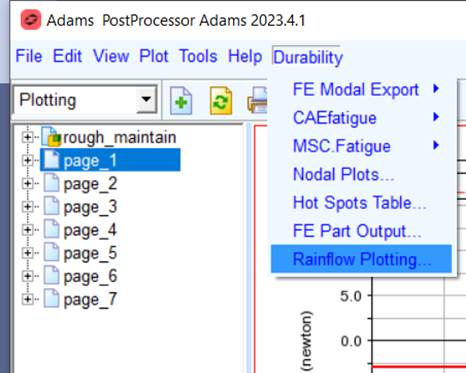
Rainflow Plotting can be accessed from the Postprocessor after loading the Durability Plugin.
Navigate tho Durability → Rainflow Plotting...
For the option: | Do the following: |
|---|---|
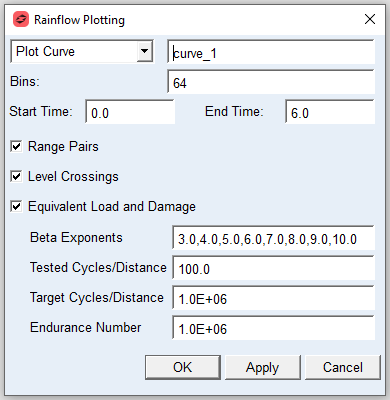
Plot Curve | Dropdown to select either a Plot Curve or a Resultset as the input time history |
Bins | Number of discrete bins used for Rainflow calculation” (lower limit: 32, upper: none) |
Start Time/End Time | Specifies the start and end times of interest for the input signal, used to select a specific range of data within a larger dataset. |
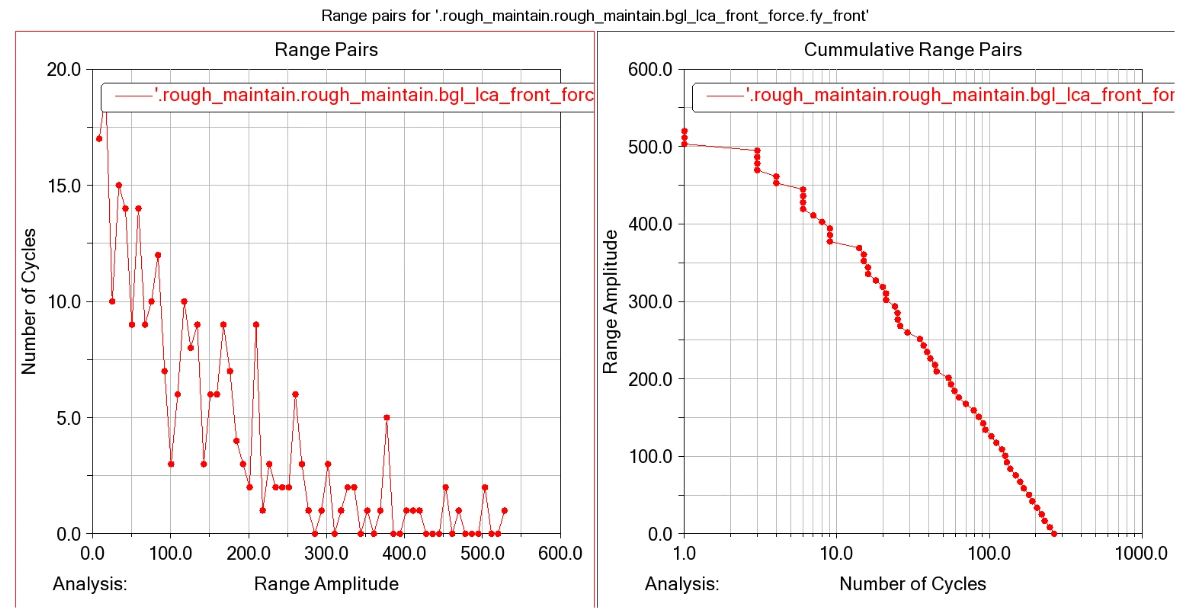
Range Pairs | Select to plot Range Pairs and Cumulative Range Pairs curves |
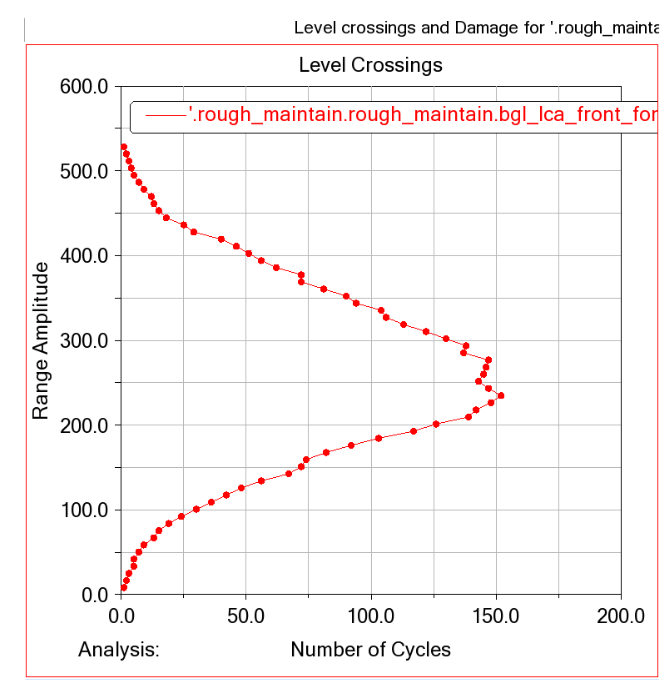
Level Crossings | Select to plot Level Crossings curve |
Equivalent Load & Damage | Select to plot Equivalent Load & Damage curve |
The following options are available only if you select Equivalent Load & Damage. | |
Beta Exponents | Woehler Beta Exponents. Typical Range: 3 (components with welds) to 10 (components without stress concentrations). Note: At least 1 number required. |
Tested Cycles/Distance | The number of cycles/distance that the input curves is representing |
Target Cycles/Distance | The number of desired cycles/distance to which the equivalent load is to correspond |
Endurance Number | Desired cycles to failure for the constant amplitude test |
Basic Rainflow plots
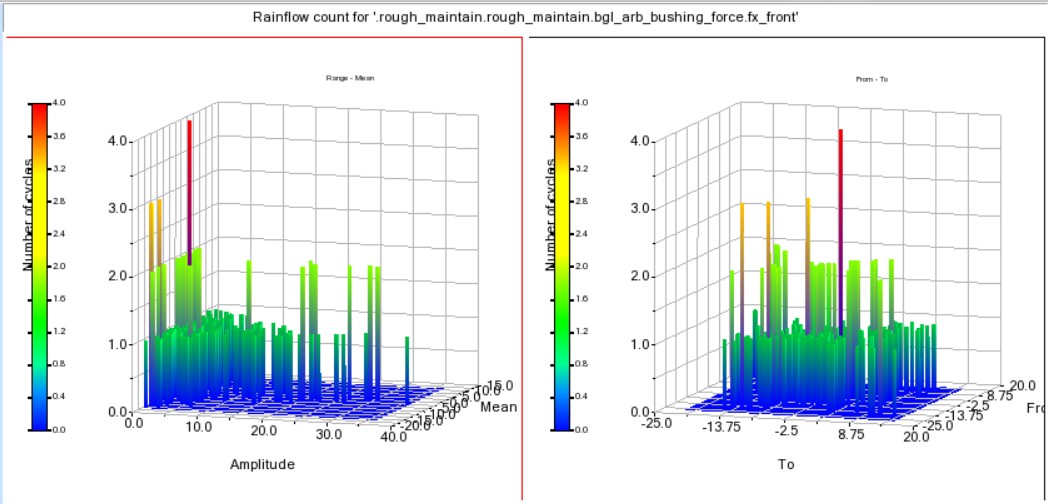
Range Pair Plots
Level Crossing Plot
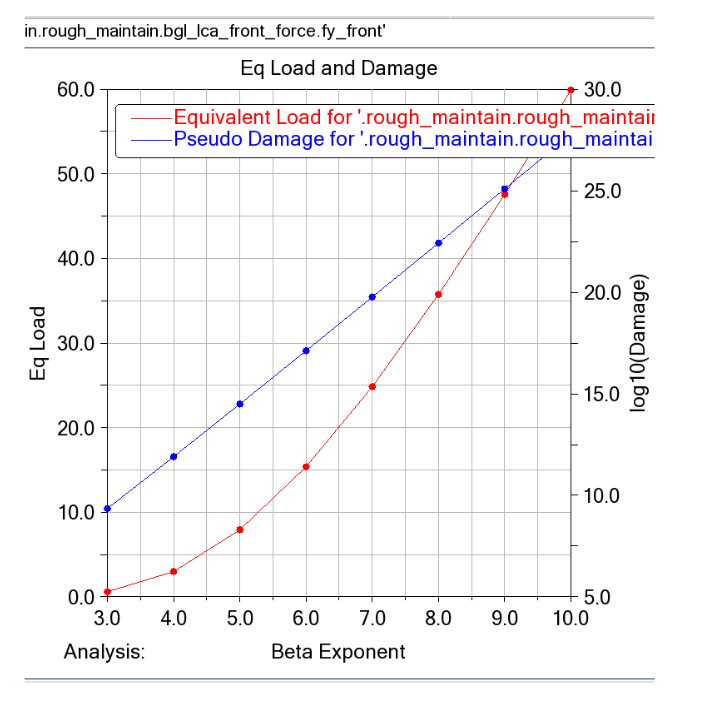
Equivalent Load & Damage