Using the Monte Carlo Method
Overview
This chapter introduces you to the Monte Carlo method of analysis. The tutorial uses a launch vehicle/spacecraft separation example to illustrate the mechanics of the solution.
The sections in this chapter are:
■About the Tutorial
 This tutorial takes about one hour to complete.
Introducing the Monte Carlo Method
The Monte Carlo method of analysis as applied to mechanical systems involves several runs with varying parameters. The goal is to provide a statistical basis for predicting mechanism performance. The foundation of the method involves characterizing parameters with a Probability Density Function (PDF). This function must be specified for each parameter that will be varied in the analysis. Examples of parameters include spring stiffnesses, damping rates, and initial rotation rates.
To learn more about the Monte Carlo method, consult a technical library. The following book is an excellent reference:
■James E. Gentle. Random Number Generation and Monte Carlo Methods. Springer-Verlag, 1998.
You can also refer to the following online references:
Starting Adams View
The section teaches you how to start Adams View on Linux and Windows.
To start Adams View on Linux:
1. Copy the install_dir/ainsight/examples/ain_tut_141_aview.cmd to your working directory, where install_dir is where the Adams software is installed. If you cannot locate this directory, please see your system administrator.
Note: | You can skip this step if you previously used the Help‡Copy Examples To feature to copy all of the tutorials for Adams Insight. Your working directory is ain_examples/aview. |
2. Type the command to start the Adams Toolbar at the command prompt, and then press Enter.
3. Select the Adams View tool  .
.
.The Adams View main window appears.
To start Adams View on Windows:
1. Copy the install_dir/ainsight/examples/ain_tut_141_aview.cmd to your working directory, where install_dir is where the Adams software is installed. If you cannot locate this directory, please see your system administrator.
Note: | You can skip this step if you previously used the Help‡Copy Examples To feature to copy all of the tutorials for Adams Insight. Your working directory is ain_examples/aview. |
2. From the Start menu, point to Programs, point to Adams 2024.1, and then select Adams View.
The Adams View main window appears.
Creating a Modeling Database
You start this tutorial by creating a modeling database that contains a new model.
To create a modeling database:
1. In the Welcome dialog box, select Import a file.
2. If the Start in text box doesn’t show the path to your working directory, select the Browse tool  . Use the Select File dialog box to navigate to your working directory, and then select OK.
. Use the Select File dialog box to navigate to your working directory, and then select OK. 3. In the Welcome dialog box, select OK.
4. In the File to Read text box, enter ain_tut_141_aview.cmd or right-click and select Browse. You can then use the Select File dialog box to open ain_tut_141_aview.cmd.
5. Select OK.
Adams View imports the command file, and then displays the launch vehicle model.
6. Zoom in on the top portion of the vehicle. Note the four forces between the adapter frustum and the spacecraft (they’re circled in the following figure).
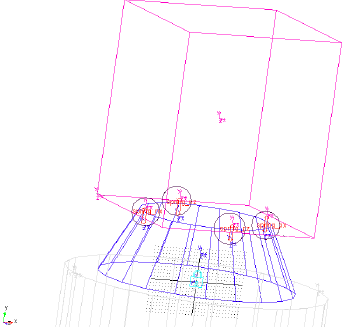
Figure 29 Launch vehicle model
Running the Simulation
Before you create your experiment, you’ll simulate the launch vehicle model in Adams View. Here, you will run and animate the simulation.
To simulate the model:
1. From the Simulate menu, select Scripted Controls.
2. In the Simulation Script Name text box, enter .separation.Sep_script. Use defaults for all other simulation options.
3. Select the Play tool  , and wait for the simulation to finish.
, and wait for the simulation to finish.Adams View runs the simulation.
4. From the Review menu, select Animation Controls.
5. Select the Play tool and wait for the animation to finish.
Note that the four forces push the spacecraft off of the launch vehicle.
6. Close the Animation Controls dialog box.
Identifying Measures
Here, you will identify the measures in the model.
To identify the measures:
1. Click the Design Exploration tab.
2. From the Measures container, click Display a Measure icon  .
.
.The Database Navigator opens, displaying the four measures for the model: three angular velocity components and a translational separation velocity component.
For information on measures, refer to the Adams View online help.
3. Close the Database Navigator.
4. From the Simulate menu, point to Design Objective, and then select Modify.
The Database Navigator opens.
5. Select separation.
The Database Navigator displays the four objectives representing the ending simulation values for each measure.
For information on design objectives, refer to the Adams View online help.
6. Close the Database Navigator.
Starting Adams Insight
In this section, you’ll open Adams Insight from Adams View and begin creating an experiment to measure the performance of a launch vehicle model.
To start Adams Insight from Adams View:
1. Click the Design Exploration tab on the Adams View ribbon.
From the Insight container, click Adams Insight Export dialog icon  .
.
. 2. Complete the Adams Insight Export dialog box as shown below:
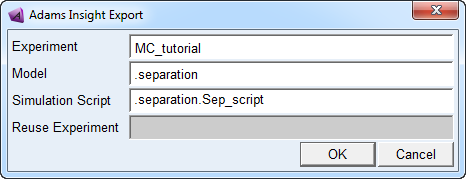
Figure 30 Adams Insight Export Dialog Box
3. Select OK.
Adams View launches Adams Insight and the Adams Insight main window appears.
Note: | On Windows systems, Adams View opens a command prompt window to launch Adams Insight. This window stays open until you close Adams Insight. Do not manually close the command prompt window. |
In the treeview of Adams Insight, note that the model has eight factors and four responses.
Creating a Design Matrix
In this section, you’ll create a design matrix to measure the performance of the launch vehicle model. This section includes:
Promoting Candidates
The first step required to creating your designed experiment is to select the factors that you want to include in your design matrix. You select factors from the Candidates list in the treeview, and then promote them to the Inclusions list. Promoting candidates to inclusions causes them to become part of your design matrix.
To promote factors from candidates to inclusions:
1. In the treeview, select the + in front of Factors. Factors expands to reveal Inclusions and Candidates.
2. Continue by expanding Candidates, and then separation. Under separation, you’ll see a list of design variables that you can include in your design matrix.
3. Select all of the candidates by holding down the Ctrl key while mouse-clicking each candidate.
4. Move your cursor to the Adams Insight toolbar and select the Promote to inclusion tool  .
.
. The candidates move to the Inclusion list under Factors in the treeview.
Tip: | To promote the factors directly from the treeview, press the shortcut key F5. |
5. In the treeview, select the + in front of Responses.
The levels nested under Responses expand to reveal Inclusions and Candidates.
Tip: | You can select the minus (-) sign in front of Factors to collapse that section of the treeview and save screen space. |
6. Continue expanding the levels under Candidates and separation. Under separation, you’ll see a list of responses that are potential candidates you can include in your design matrix.
7. Select and promote all of the responses just as you promoted the factors in 3..
The responses move from the Candidates to the Inclusion list as shown in Figure 31.
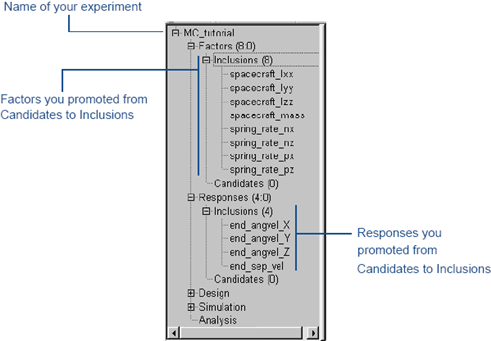
Figure 31 Treeview Showing Inclusions
Modifying Factors
After you promote your factors, you define parameters for them in the Factor form. To learn more about factor parameters, press the F1 key from the Factor form.
To modify your factors:
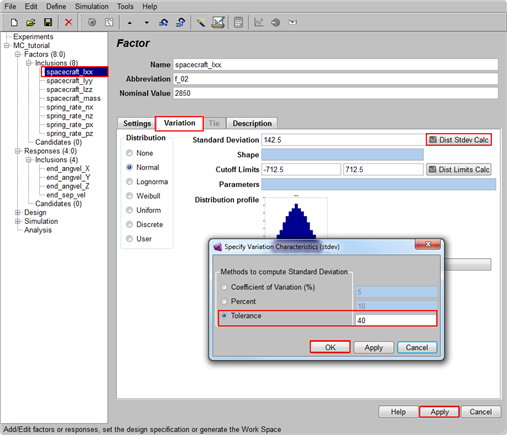
1. In the treeview, find the factors in the Inclusions list. Select the factor spacecraft_lxx.
2. In the Factor form, select the Variation tab.
3. Set Distribution to Normal.
4. Select the Calculator tool  next to the Standard Deviation text box.
next to the Standard Deviation text box.The Specify Variation Characteristics dialog box appears.
5. Select Tolerance, enter 40 in the corresponding text box, and then select OK.
6. Select Apply in the Factor form.
Adams Insight saves your factor modifications.
7. Modify the parameters for the remaining factors as follows. Be sure to select Apply after modifying each factor.
Factor: | Variation Distribution: | Tolerance: |
|---|---|---|
spacecraft_lyy | Normal | 30 |
spacecraft_lzz | Normal | 35 |
spacecraft_mass | Uniform | Click Apply with the default displayed option in the Factor form. |
spring_rate_nx | Normal | 200 |
spring_rate_nz | Normal | 200 |
spring_rate_px | Normal | 200 |
spring_rate_pz | Normal | 200 |
Setting Design Specifications
In this section, you’ll set the design objective and design type for your experiment. To learn more about setting design specifications, press the F1 key from the Design Specification form.
To specify your design objective:
1. In the Adams Insight toolbar, select the Set design specification tool  .
.
. 2. Complete the Design Specification form as shown next.
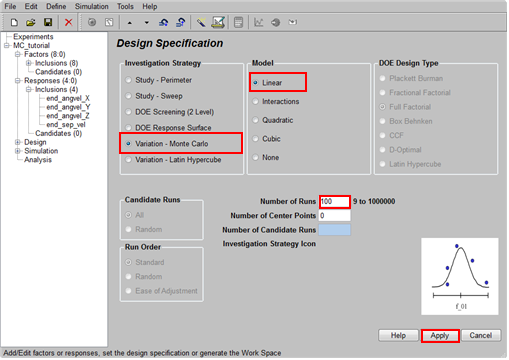
Figure 32 Variation - Monte Carlo
3. Select Apply.
4. To create the work space, select the Generate Work Space tool  .
.
.The Work Space appears in the viewport. Note that the response columns are empty.
5. From the treeview, under Design, select Work Space Review.
6. Select a factor and view its histogram plot.
Running the Experiment
Once you’ve verified the information in the Work Space, you’re ready to run the simulations.
To run the simulation:
1. In the Adams Insight toolbar, select the Run simulations tool. You can also select the Simulation menu, point to Build-Run-Load, and then select All.
Adams View displays and runs the simulations defined by your experiment.
2. In the information window that opens, select OK.
Note: | This procedure builds, runs, and postprocesses all of the simulations within the Adams View session. We recommend that you break up the process flow into its separate phases using the MDI INSIGHT BUILD and MDI INSIGHT LOAD commands. This is especially important when you have more than 30 trials. |
Reviewing Results
After Adams View completes the trials defined in your design matrix, you return to the Adams Insight interface to view the results.
To return to Adams Insight:
1. From the Main menu in Adams View, point to Simulate, point to Adams Insight, and then select Display.
1. Click the Design Exploration tab on the Adams View ribbon.
From the Insight container, click the Adams Insight display icon  .
.
.The Adams Insight Display dialog box appears.
2. Verify the name of your current experiment, and then select OK.
The Adams Insight window replaces the Adams View window.
To view your simulation results:
1. In the treeview, under Design, select Work Space.
Simulation results from Adams View appear in the response columns.
2. In the treeview, under Design, select Work Space Review.
3. Select the first response, r_01.
The histogram for this response appears above the table as shown in Figure 33. The table includes mean, variance, standard deviation, minimum, maximum, and range values for each factor and each response.
4. Select the other responses to view their histograms.
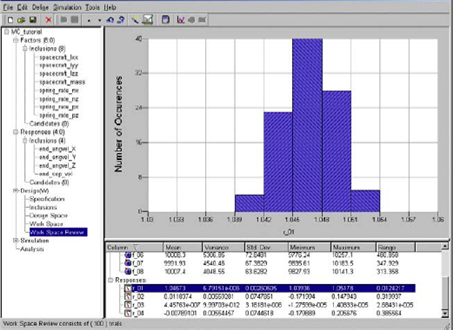
Figure 33 Histogram Plot for r_01