Building 4D Plots
4D Plotting Basics
How to Choose 4D Plotting Mode
There are a number of ways to specify that an Adams Postprocessor window view be designated for 4D plotting.
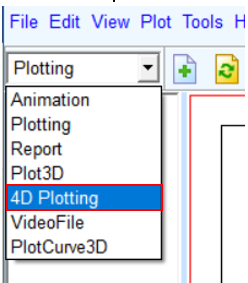
■Choose "4D Plotting" mode from options available in Adams Post Processor
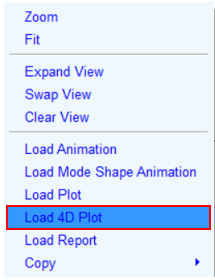
■Right mouse click and select the context menu option "Load 4D Plot" on any of panes in Adams Post Processor
■Use the Adams View Command Language:
interface plot window set_mode mode = plot4d
Learn more about Adams View Command Language.
What is a 4D Plot
General 3D Plotting is basically meant for visualizing results by defining a surface in three-dimensional space with X, Y and Z values, where color interpolation is done based on minimum and maximum values of Z. The term "4D Plotting" comes from the ability to add another dimension whereby the surface color can, itself, be an independent parameter and can be plotted based on a different result channel.
Types of 4D Plots
There are two combinations of data types which are supported for 4D Plot creation.
1. Result vs Time across Analyses
This combination helps in analyzing a particular result set component across multiple analyses. That is, the result set component of interest is the Z axis data (or "height" of the surface/curves) and the X and Y axes are time and analyses (in either order). Finally, one can choose to color the surface based on the Z axis data values or based on the values of another result set component.
To summarize the allowable axis combinations:
■X axis: Time / Analyses
■Y axis: Time / Analyses
■Z axis: Result set component
■Color: Result set component
Note that the set of analyses chosen must have the same time characteristics (that is, same start and end time, and same output step sizes).
2. Results vs Time across Fixed values
This combination is meant to plot different result set components across fixed values. That is, a result set component for each user-specified fixed value. The fixed values would have some meaning of significance to each of the corresponding result set components. The user will specify the mapping of fixed values to result set components. A common application is mapping load or motion results to locations in the model. For example, results for loads along a shaft might be organized using fixed values defining the relative position on the shaft.
So, the result set component of interest is the Z axis data (or "height" of the surface/curves) and the X and Y axes are time and fixed values (in either order). Finally, one can choose to color the surface based on the Z axis data values or based on the values of another result set component.
To summarize the allowable axis combinations:
■X axis: Time / Fixed values
■Y axis: Time / Fixed values
■Z axis: Result set components
■Color: Result set components
Note that if result set components are chosen coming from different analyses, those analyses must have the same time characteristics (that is, same start and end time, and same output step sizes).
4D Plot Rendering options
There are three different ways by which data can be rendered with 4D plotting: as a surface, as stacked curves or as a Color Map.
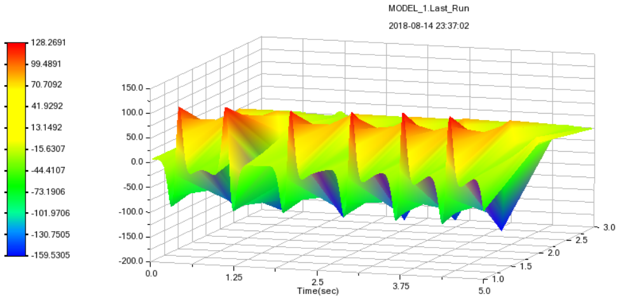
1. Surface
With the surface option, the data is rendered as a geometrical surface mesh. The colors are interpolated between the actual result points (the "nodes" of the surface's geometrical mesh). Note that in order to render this surface the number of Z values must equal the number of X*Y values.
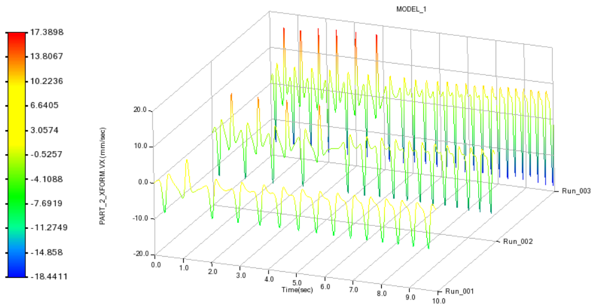
2. Stacked Curves
With the stacked curves option the data are rendered as a series of 2D polylines, one for each 2D curve in the Z-X or Z-Y plane. This rendering option is particularly useful when one does not want to infer any conclusions about the results between curves. Note that in order to render this surface the number of Z values must equal the number of X*Y values.
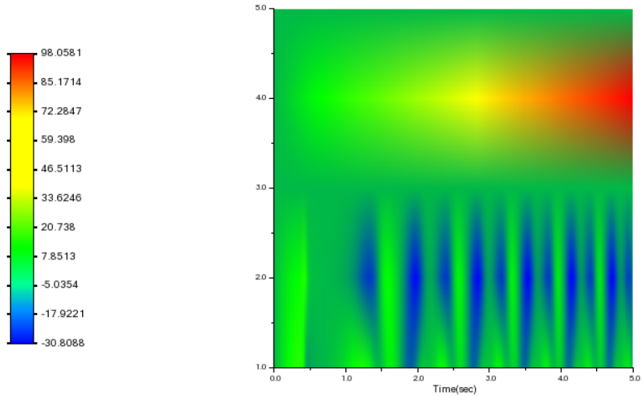
3. Color Map
If the Z Axis checkbox is not selected, a surface will not be generated. The data will be rendered as a 2D color map, where the color values come from the specified result set components.