Plotting ODS
Plot -> Operational Deflection Shape
Allows you create an ODS plot from a time-domain reference curve or result set.
For the option: | Do the following: |
|---|---|
Tips on Entering Object Names in Text Boxes. | |
Plot Type | Specify the desired plot type from the pull down menu. See the section below for a definition of the various plot types and a description of the signal processing behind each type. |
Plot Curves or Result Set Components | Option to specify one or more Curves or Result sets to plot. |
Curve | Specify one or more curves (plot data) to include in the plot. |
Reference Curve | Specify curve to as the reference signal in the plot. Required for Cross Correlation, Transfer Function or ODS plot types. Not required for FFT, Auto Spectrum or PSD plot types. |
Result | Specify one or more result set components (plot data) to include in the plot. |
Reference Result | Specify result set component as the reference signal in the plot. Required for Cross Correlation, Transfer Function or ODS plot types. Not required for FFT, Auto Spectrum or PSD plot types. |
Time Start | Enter the starting time of the time domain analysis to compute the ODS data. Default is 0.0 |
Time End | Enter the ending time of the time domain analysis to compute the ODS data. |
(Segment option) | Specify either the Number of Segments or Points per Segment in the menu option box. |
(Overlap option) | Specify either the number of Overlap Points or Overlap % in the menu option box. |
Detrend | Specify to compute with Detrend or not. |
Window | Specify window option from the pull down menu. |
Information | This section of the dialog box displays the resulting window parameters computed from the settings above for the ODS analysis plot. |
Signal Processing Description
Assume the two time signals  and
and  . Here they will represent the values of Curve and Reference Curve. Perform a FFT on each of the curves and let
  and
and  . These are of course complex vectors, each with half as many points as the original time signals. All plotting types, except PSD, are derived from the FFT. FFT, Auto Spectrum and PSD all describes the frequency content of one signal only with different scaling. Phase is of no interest or does not exist for these types of measures. Cross correlation, transfer function (Bode) and ODS are different measures on how one signal refers to another and here the phase is important.
and . Here they will represent the values of Curve and Reference Curve. Perform a FFT on each of the curves and let and . These are of course complex vectors, each with half as many points as the original time signals. All plotting types, except PSD, are derived from the FFT. FFT, Auto Spectrum and PSD all describes the frequency content of one signal only with different scaling. Phase is of no interest or does not exist for these types of measures. Cross correlation, transfer function (Bode) and ODS are different measures on how one signal refers to another and here the phase is important.Plot Type Definitions
FFT | Plot the magnitude and phase of the corresponding Fast Fourier Transform (FFT) of the specified curve. Magnitude 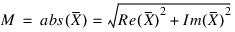 and andphase 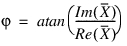 . . Units for the magnitude is the same as the units for  . The phase is of no interest in this case but is included for completeness. . The phase is of no interest in this case but is included for completeness. |
Auto Spectrum | Also called auto correlation or Power spectrum (not to be confused with power spectral density “PSD”). units. It is calculated as  where where  denotes denotesthe complex conjugate of  and L is the length of the signal (segment length when using averaging). The unit is the unit and L is the length of the signal (segment length when using averaging). The unit is the unit  /frequency. There is no phase related to the auto spectrum. /frequency. There is no phase related to the auto spectrum. |
PSD | Power Spectral Density plot is similar to auto spectrum but with different scaling. It is calculated using the Pwelch function directly from the time domain signal. |
Cross Correlation | Plot to show how the frequency content of one signal relates to the frequency content of another signal. Calculated as  where where  denotes the complex denotes the complexconjugate of  . It has both magnitude and phase. One advantage of CC is that if Y has no amplitude at a given frequency, the cross correlation at that frequency is zero. . It has both magnitude and phase. One advantage of CC is that if Y has no amplitude at a given frequency, the cross correlation at that frequency is zero. |
Transfer Function | Another way to plot cross correlation between two signals of both magnitude and frequency. The transfer function is calculated as  . It has both magnitude and . It has both magnitude andfrequency. The transfer function gives similar information as the cross correlation, but if Y has very low magnitude at some frequency, the transfer function can have a very high value making the cross correlation a better tool for comparing frequency content between signals. |
ODS | Phase adjusted auto spectrum plot. This is the most common way to look at relationship between signals for an Operational Deflection Shape, ODS analysis. It is the auto spectrum of both signals X and Y. However, as the auto spectrum does not have a phase, the ODS phase is calculated as the phase of X relative to Y for each frequency. 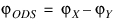 |