Performing a Baseline Parallel Wheel Travel Analysis
You now perform a parallel wheel travel analysis on the suspension and steering assembly, and then plot and view the results, as explained in the following sections:
Defining Vehicle Parameters
Before performing a suspension analysis, you must specify several parameters about the vehicle in which you intend to use the suspension and steering subsystems. These parameters include the vehicle’s wheel base and sprung mass, whether or not the suspension is front- or rear-wheel drive, and the braking ratio. For this analysis, you enter the parameters to indicate front-wheel drive and a brake ratio of 64% front and 36% rear.
To define vehicle parameters:
1. From the Simulate menu, point to Suspension Analysis, and then select Set Suspension Parameters.
The Suspension Analysis: Setup Parameters dialog box appears. It contains default settings to help you quickly set up a suspension analysis.
2. Set up the analysis as follows:
■Suspension Assembly: my_assembly
■Tire Model: User Defined
■Tire Unloaded Radius: 300
■Tire Stiffness: 200
■Wheel Mass: 10.0
■Sprung Mass: 1400
■CG Height: 300
■Wheelbase: 2765
■Drive Ratio: 100
All driving force is applied to the front wheels.
■Brake Ratio: 64
The brake ratio value indicates the % of braking force that is applied to the front brakes.
3. Select OK.
Performing the Analysis
Now that you’ve defined the vehicle parameters, you can run the parallel wheel travel analysis. During the analysis, the test rig applies forces or displacements, or both, to the assembly, as defined in a loadcase file. For this analysis, Adams Car generates a temporary loadcase file based on the inputs you specify.
This parallel wheel travel analysis moves the wheel centers from -100 mm to +100 mm relative to their input position, while holding the steering fixed. During the wheel motion, Adams Car calculates many suspension characteristics, such as camber and toe angle, wheel rate, and roll center height.
To perform the analysis:
1. From the Simulate menu, point to Suspension Analysis, and then select Parallel Wheel Travel.
2. Set up the analysis as follows:
■Suspension Assembly: my_assembly
■Output Prefix: baseline
■Number of Steps: 15
■Mode of Simulation: interactive
■Bump Travel: 100
■Rebound Travel: -100
■Travel Relative To: Wheel Center
■Steering Input: Angle
3. Select the Comment tool  .
.
. 4. In the Comment Text text box, enter Baseline Parallel Wheel Travel Analysis.
5. Select OK.
6. Select OK again.
The Message Window appears, informing you of the steps Adams Car takes when performing the analysis. Adams Car analyzes the suspension and steering assembly and applies to it the displacements and loads defined in the submission dialog box.
7. When the analysis is complete, select Close.
Animating the Results
In this section, you view the analysis you just ran. Adams Car has already loaded the animation and graphic files for you.
To animate the results:
1. From the Review menu, select Animation Controls.
2. Select the Play tool  .
.
.Adams Car animates the motion of the suspension analysis. Notice that the suspension moves from rebound (down), to bump (up), and that the steering wheel does not rotate.
3. When the animation is complete, close the dialog box.
Plotting the Results
In this section, you create several plots from the parallel wheel travel analysis results. In a plot configuration file, we have provided all the information that Adams Car needs to create the plots. The plot configuration file not only specifies which plots Adams Car should create, but also how the plots should look, including their horizontal and vertical units, and colors. Storing plotting information in a plot configuration file lets you quickly regenerate plots after each analysis.
To plot the results:
1. Press F8 Key or Launch Adams PostProcessor as explained in Plotting Results.
2. From the Plot menu, select Create Plots.
3. Enter the following specifications:
■Plot Configuration File: mdids://shared_car_database/plot_configs.tbl/mdi_suspension_short.plt
■Plot Title: Baseline Parallel Travel Analysis - UAN_FRT_SUSP
4. Select OK.
Adams Car creates the plots. To cycle through the plots, from the Main toolbar, use the Previous Pages and Next Pages tools  .
.
. 5. View the plot named Scrub Radius, shown next. Scrub radius is the distance from the point at the intersection of the steering axis (also known as the kingpin axis) and the ground plane, to the line of intersection of the wheel and ground planes.
Plot of Scrub Radius versus Wheel Travel
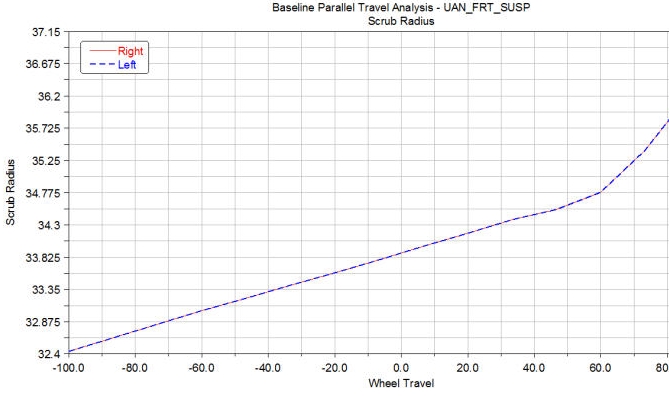
Notice that the scrub radius varies little with wheel travel and is approximately 34 mm. A positive scrub radius means the steering axis lies inboard of the center of the tire contact patch.
From the analysis you’ve completed, you have enough information to calculate the approximate torques produced about the steering axes using the difference in left to right braking forces and the 34 mm scrub radius.
In addition, using the results of that calculation and the steering geometry, you can calculate the resulting unbalanced force at the steering rack and the pull (torque) needed at the steering wheel to keep the wheels straight.
In the next sections, you use Adams Car to perform these calculations.
Deleting Plots
To prepare for the baseline pull analysis, delete the plots you created in the previous sections.
To delete plots:
1. In the treeview, hold down the left mouse button, and then drag the cursor across the names of the plots you want to delete.
2. From the Edit menu, select Delete.
3. From the File menu, select Close Plot Window or press F8.
Adams Car returns to the main window.