Performing a Baseline Pull Analysis
You can now perform a baseline pull analysis to study the pull on the steering wheel. You will use the results of this pull analysis as the baseline against which you compare the results of another pull analysis that you perform after you modify the location of the steering axis. By comparing the results from the two analyses, you can determine if the modifications were successful.
Performing a baseline pull analysis involves the following:
Defining a Loadcase File
Before you can run the baseline pull analysis, you need to create a loadcase file to drive the analysis. In the loadcase file, you specify the unequal braking forces to simulate braking on a split-μ surface and the beginning, or upper, and ending, or lower, steering wheel angles.
To calculate the unequal brake forces, we assume that the vehicle is braking at a rate of 0.5 g’s deceleration, with a 64% front and 36% rear brake ratio, a vehicle mass of 1,400 kg, and the front braking force split 55% left and 45% right. Based on these assumptions, the total front braking force is:
1,400 kg * 0.5 g’s ∗ 9. 81 m/s2/g * 0.64 = 4,395 N
From this, the left and right braking forces are:
■Left braking force = 0.55 * 4,395 N or 2,417 N
■Right braking force = 4,395 N - 2,417 N or 1,978 N
You can use these calculations to define the loadcase file.
To define a loadcase file:
1. From the Simulate menu, point to Suspension Analysis, and then select Create Loadcase.
Note: | If Select Loadcase Type is not set to Static Load, your dialog box will look slightly different. Make sure you select Static Load first, and then proceed to fill in the dialog box. |
2. Fill in the dialog box as shown next, and then select OK.
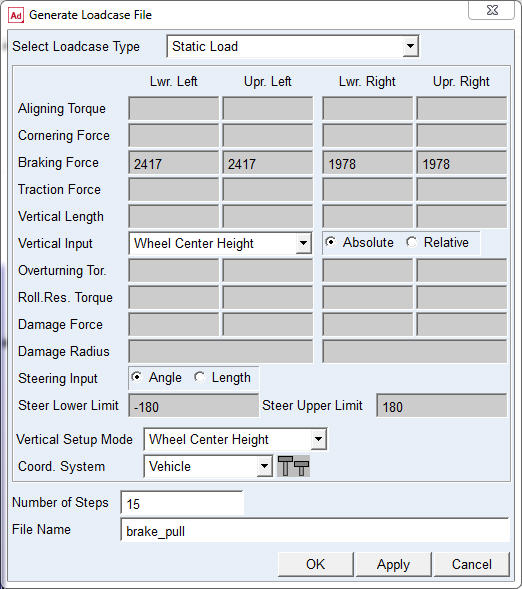
Adams Car creates the loadcase file, named brake_pull.lcf, and stores it in your private database. It stores the loadcase file as text (ASCII) and you can print it or edit it manually.
To create the loadcase file, Adams Car takes the parameters that you entered and generates a table of input values. For the parameters that you entered, Adams Car generates a table that varies steering wheel angle from -180 to 180 in 15 steps, while holding the braking forces constant.
Table 1 shows the loadcase file values
:
Steering Wheel: | Left Brake Force: | Right Brake Force: |
|---|---|---|
-180 | 2417 | 1978 |
-156 | 2417 | 1978 |
-132 | 2417 | 1978 |
-108 | 2417 | 1978 |
-84 | 2417 | 1978 |
-60 | 2417 | 1978 |
-36 | 2417 | 1978 |
-12 | 2417 | 1978 |
12 | 2417 | 1978 |
36 | 2417 | 1978 |
60 | 2417 | 1978 |
84 | 2417 | 1978 |
108 | 2417 | 1978 |
132 | 2417 | 1978 |
156 | 2417 | 1978 |
180 | 2417 | 1978 |
Performing the Analysis
You can now use the loadcase file that you just created to perform an analysis that determines the pull characteristics of the suspension and steering assembly.
To perform the pull analysis:
1. From the Simulate menu, point to Suspension Analysis, and then select External Files.
2. Set up the analysis as follows:
■Suspension Assembly: my_assembly
■Output Prefix: baseline
■Mode of Simulation: interactive
■Loadcase Files: mdids://private/loadcases.tbl/brake_pull.lcf
3. Make sure Load Analysis Results is selected.
4. Select OK.
Animating the Results
In this section, you view an animation of the analysis Adams Car just performed.
To animate the results:
1. From the Review menu, select Animation Controls.
2. Select the Play tool.
Adams Car animates the turning motion of the steering subsystem. You should see the wheels turn as the steering wheel rotates. The wheel centers should not move vertically.
3. Close the Animation Controls dialog box.
Plotting the Results
You can now use the results from the baseline pull analysis to create two plots, as explained in the following sections:
Plotting Steering Wheel Torque versus Steering Wheel Angle
You now create a plot of the steering wheel torque versus the steering wheel angle.
To set up the plot:
1. Press F8 or Launch Adams PostProcessor just as you did before.
2. From the treeview, double-click page_1.
3. Select plot_1.
4. In the property editor, clear the selection of Auto Title and Auto Subtitle.
5. In the Title text box, enter Brake Pull Analysis.
6. In the Subtitle text box, enter Steering Wheel Torque vs Steering Wheel Angle.
7. Right-click the treeview area, point to Type Filter, point to Plotting, and then select Axes.
8. From the treeview, double-click plot_1, and then select haxis.
9. In the property editor, select the Labels tab.
10. In the Label text box, enter Steering Wheel Angle [degrees].
11. From the treeview, select vaxis.
12. In the Label text box, Steering Wheel Torque [Nmm].
To create the plot:
1. Verify that Source is set to Requests.
Adams Car automatically displays data information.
2. From the Simulation list, select baseline_brake_pull.
3. From the right of the dashboard, set Independent Axis to Data.
The Independent Axis Browser appears. You perform the next four steps in the browser.
4. From the Filter list, select user defined.
5. From the Request list, select steering_displacements. You might have to scroll down to see this entry.
6. From the Component list, select angle_front.
7. Select OK.
8. From the Filter list, select user defined.
9. From the Request list, expand test rig in the Request list, and then select steering_wheel_input.
10. From the Component list, select steering_wheel_input_torque.
11. Select Add Curves.
Adams Car takes the data requested and automatically generates the curve on the current plot template, as shown next:
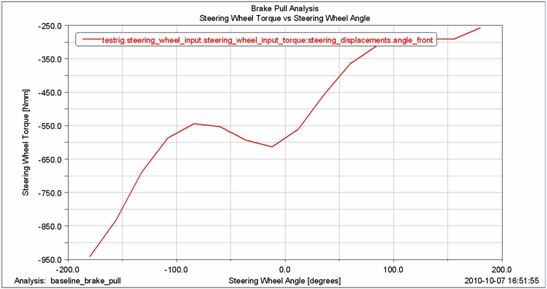
Figure 3 Plot of Steering Wheel Torque versus Steering Wheel Angle
The plot shows the torque that the test rig applies to the steering wheel to hold the wheel in position. The torque is negative, meaning that the test rig applies a clockwise torque to counteract the unequal braking force that pulls the wheel counterclockwise, as if making a left turn.
Plotting Scrub Radius versus Steering Wheel Angle
In this section, you create a plot of the scrub radius versus the steering wheel angle. After you create the plot, you can modify it to change the number of divisions in the vertical and horizontal axes so they cover a larger range and define the minimum and maximum limits to be displayed in the vertical axis.
To set up the plot:
1. From the Main toolbar, select the New Page tool  .
.
. 2. In the treeview, double-click page_2.
3. Select plot_2.
4. Make sure that Auto Title and Auto Subtitle are not selected.
5. In the Title text box, enter Brake Pull Analysis.
6. In the Subtitle text box, enter Scrub Radius vs Steering Angle.
7. Right-click the treeview area, point to Type Filter, point to Plotting, and then select Axes.
8. Double-click plot_2 to expand it so the names of the axes are visible.
9. From the treeview, select haxis.
10. In the property editor, select Labels.
11. In the Label text box, enter Steering Wheel Angle [degrees].
12. From the treeview, select vaxis.
13. In the Label text box, enter Scrub Radius [mm].
To create the plot:
1. Verify that Source is set to Requests.
2. From the Simulation list, select baseline_brake_pull.
3. From the Filter list, select user defined.
4. From the Request list, expand test rig in the Request list, and then select scrub_radius.
5. From the Component list, select left.
This defines the vertical axis component.
6. Select Add Curves.
Adams Car takes the data requested and generates the curve on the current plot template, as shown next:
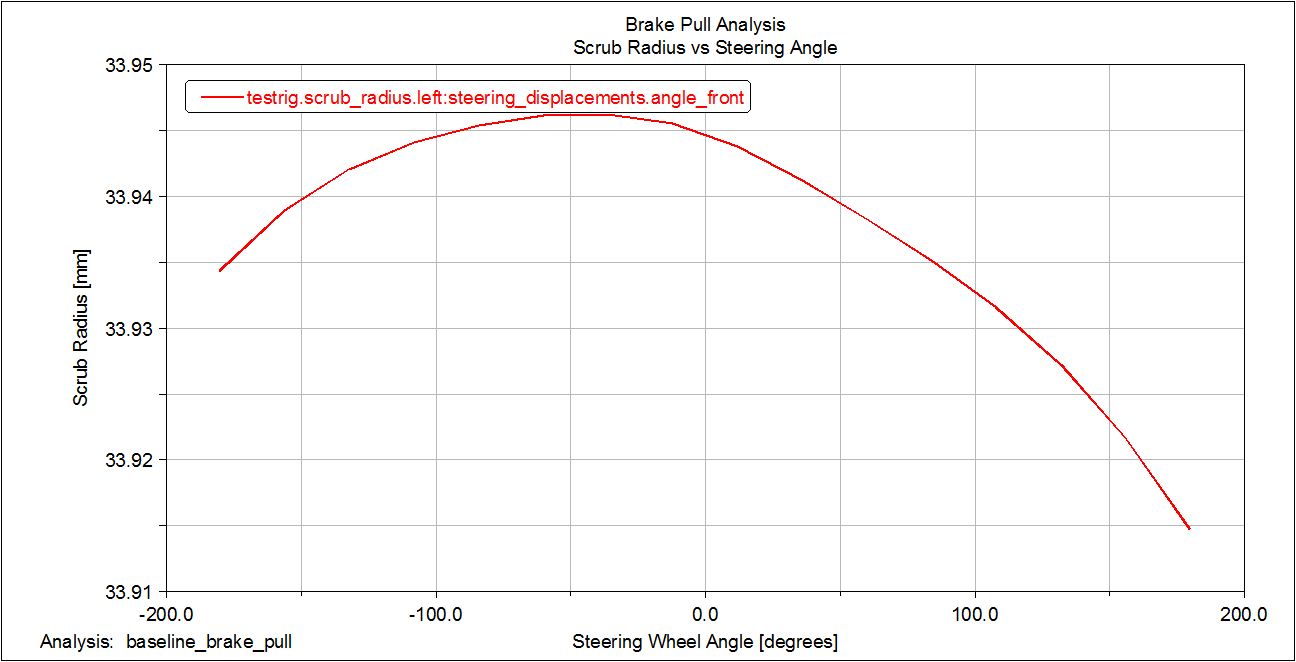
Figure 4 Plot of Scrub Radius versus Steering Angle
Notice that the scrub radius appears to vary a lot with respect to the steering angle because of the vertical plot scale, when in fact it only varies 0.21 mm over the total range of steering wheel angle. To show that this variation is small, you must modify the vertical axis so it covers a larger range of values.
To modify the plot:
1. Select the vertical axis.
2. From the property editor, select the Format tab.
3. Clear the selection of Auto Scale.
4. In the Limits text boxes, enter 0 and 100.
A modified plot appears as shown next.
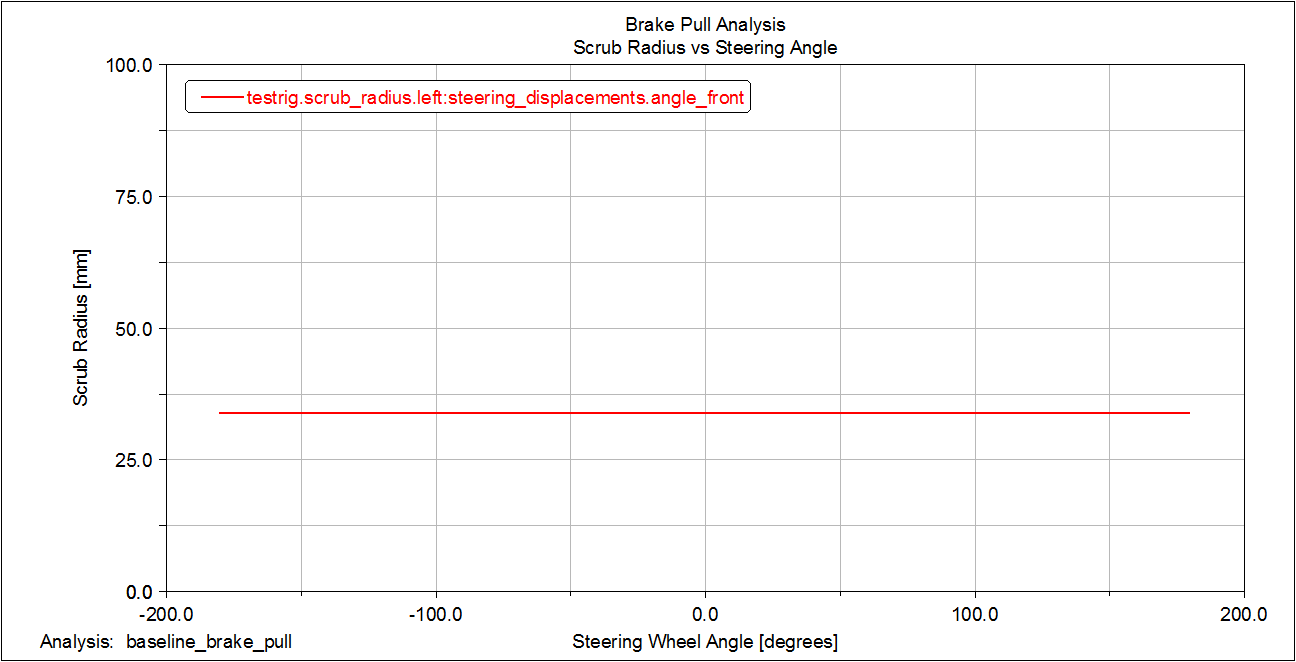
Figure 5 Modified Plot of Scrub Radius versus Steering Wheel Angle
Notice that the variation in scrub radius with respect to the steering wheel angle now appears smaller.
Saving the Plot Configuration
Saving the changes that you made to the plots in a plot configuration file lets you easily recreate the plots later in this tutorial, after you modify the suspension and steering assembly.
To save the plot configuration:
1. From the File menu, point to Export, and then select Plot Configuration File.
2. In the Configuration File Name text box, enter brake_pull.
3. Make sure All Plots is selected.
4. Select OK.
5. From the File menu, select Close Plot Window or press F8.
Adams Car returns to the main window.