Performing a Baseline ISO Lane-Change Analysis
You now perform a baseline ISO lane-change analysis on the new assembly and then plot and view the results. You then modify the spring and analyze the assembly again.
In an ISO lane-change analysis, the Driving Machine drives your full vehicle through a lane-change course as described in ISO-3888: Double Lane Change. You specify the gear position and the desired speed at which to perform the lane change. The analysis stops after the vehicle travels 250 meters; therefore, the time to complete the maneuver depends on the speed you input.
The following sections explain how to perform a baseline ISO lane-change analysis:
Setting Up the Analysis
You can now specify the inputs for the full-vehicle analysis and perform an ISO lane-change maneuver. Note that the analysis is event-based, so its duration depends on the dynamic of the vehicle and on the length of the course.
To set up the analysis:
1. From the Simulate menu, point to Full-Vehicle Analysis, point to Course Events, and then select Double Lane Change.
2. Set up the analysis with the following characteristics:
■Output Prefix: iso1
■Initial Velocity: 100 (km/h)
■Gear Position: 3
3. Select OK.
Adams Car updates the properties of force entities, such as dampers, springs, and bushings, with the values specified in their property files and then sets up the vehicle assembly for the maneuver. When you submit the analysis, Adams Car automatically generates an event file (.xml). The name of the .xml follows the same naming convention as the other files that Adams Car generates: output_prefix_maneuver_name.
The test rig, which is part of the assembly, applies the inputs you specified in the .xml to the assembly, and performs a dynamic analysis.
For information on the Driving Machine and XMLs, see the online help for Adams Car.
Note: | XML event files replace TimeOrbit DCF files. Adams Car still supports DCF files, but it automatically converts them to their XML representation. |
4. To modify or view an XML event file, follow these steps:
■From the Simulate menu, point to Full Vehicle Analysis, and then select Event Builder.
■From the File menu in the Event Builder menu, select Open.
■Browse to the current working directory, and then double-click iso1_dlc.xml.
■To locate the current working directory, from the File menu in Adams Car, choose Select Directory. This displays a file browser with the current working directory highlighted.
For more information on the Event Builder, see the F1 help.
The path description of the ISO lane-change course is referenced in the <DcfMachine> tag of ISO lane change of the .xml file. This information is stored in a driver control data (.dcd) file, as shown below.
[MDI_HEADER]
FILE_NAME = iso_lane_change.dcd
FILE_TYPE = 'dcd'
FILE_VERSION = 1.0
FILE_FORMAT = 'ASCII'
(COMMENTS)
{comment_string}
'Example DCD file of ISO-Lane Change Path'
$------------------------------------------------UNITS
[UNITS]
LENGTH = 'meters'
FORCE = 'newton'
ANGLE = 'radians'
MASS = 'kg'
TIME = 'sec'
$------------------------------------------------CLOSED_LOOP
[CLOSED_LOOP]
STEERING_CONTROL = 'path'
SPEED_CONTROL = 'none'
(DATA)
{ X Y }
0.0 0.000
45.0 0.000
52.5 0.000
60.0 0.000
90.0 3.586
102.0 3.586
115.0 3.586
140.0 0.172
147.0 0.172
155.0 0.172
162.0 0.172
170.0 0.172
200.0 0.172
300.0 0.172
400.0 0.172
500.0 0.172
{ X Y }
0.0 0.000
45.0 0.000
52.5 0.000
60.0 0.000
90.0 3.586
102.0 3.586
115.0 3.586
140.0 0.172
147.0 0.172
155.0 0.172
162.0 0.172
170.0 0.172
200.0 0.172
300.0 0.172
400.0 0.172
500.0 0.172
For information on .dcd files, see the online help for Adams Car.
Animating and Plotting the Results
Adams Car has already loaded the analysis results files for you, so you can now view the results of the analysis you just ran. Before you animate, you should change the magnification of your assembly so you can see the path the vehicle is taking.
After you animate, create two plots to represent the following:
■Vehicle lateral acceleration versus time
■Roll angle of the vehicle versus the lateral acceleration
To create a plot of the lateral acceleration versus time:
1. Launch Adams PostProcessor.
2. Select Clear Plot.
3. Verify that Source is set to Requests.
4. From the Simulation list, select iso1_ilc.
5. From the Filter list, select user defined.
6. From the Request list, select chassis_accelerations.
7. From the Component list, select lateral.
8. Set the Independent Axis to Time.
9. Select Add Curves.
Adams PostProcessor displays the plot you requested, as shown next:
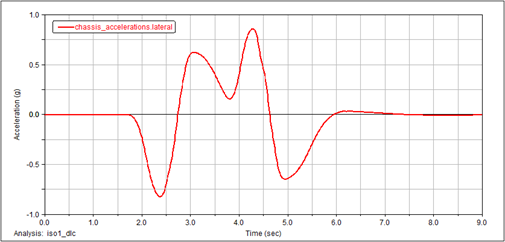
Figure 5 Plot of Lateral Acceleration versus Time
To create a plot of the roll angle with respect to lateral acceleration:
1. Select Clear Plot.
2. From the Request list, select chassis_displacements.
3. From the Component list, select roll.
4. Set the Independent Axis to Data.
The Independent Axis Browser appears. You perform the next four steps in the browser.
5. From the Filter list, select user defined.
6. From the Request list, select chassis_accelerations.
7. From the Component list, select lateral.
8. Select OK.
9. Select Add Curves.
Adams PostProcessor displays the plot you requested, as shown next:
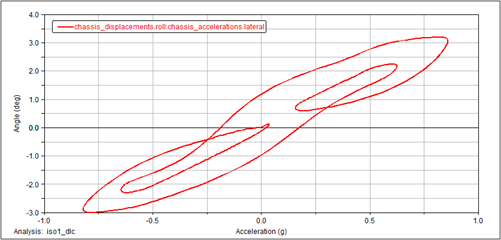
Figure 6 Plot of Roll Angle versus Lateral Acceleration
Saving the Plot Configuration
Saving the plot configuration allows you to easily recreate the plots later in this tutorial after you modify the full-vehicle assembly.
To save the plot configuration:
1. From the File menu, point to Export, and then select Plot Configuration File.
2. In the Configuration File Name text box, enter iso_lane_change.
3. Make sure All Plots is selected.
4. Select OK.
5. Return to Adams Car.
Modifying the Full-Vehicle Assembly
To change the roll angle versus lateral acceleration vehicle characteristic, modify the spring by creating and assigning a new property file.
After you create a spring property file, assign the newly created property file to the front and rear springs.
To create a new spring property file:
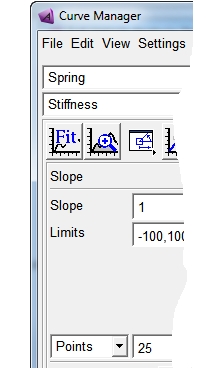
1. From the Tools menu, select Curve Manager.
2. From the File menu, select New.
3. Verify that Type is set to spring.
4. Select OK.
Adams Car generates a plot of the force characteristic versus spring displacement in the plot window of the Curve Manager.
5. In the Slope text box, enter 225.
6. Make sure the extension/compressions limits are set to
-100, 100.
-100, 100.
7. Select Apply.
Adams Car modifies the spring characteristic.
8. In the Free Length text box, enter 300.
9. Select Apply.
10. From the File menu, select Save.
11. In the File text box, enter my_spring.
12. Select OK.
13. Close the Curve Manager.
Adams Car returns to the main window.
To modify the springs:
1. In the model, right-click the front spring, ns[lr]_ride_spring, and then select Modify.
The Modify Spring dialog box loads the spring parameters in the text boxes.
2. Right-click the Property File text box and, from your default writable database, select my_spring.spr.
3. Replace Installed Length with Preload.
4. Enter a Preload of 5500.
5. Select Apply.
Adams Car assigns the new property file to the spring.
6. Repeat Steps 1 through 4 for the rear springs.
7. Select OK.
Performing an Analysis on the Modified Full-Vehicle Assembly
To determine how the modifications to the suspension subsystem affected the behavior of the vehicle, perform another double lane-change analysis.
To perform the analysis:
1. From the Simulate menu, point to Full-Vehicle Analysis, point to Course Events, and then select Double Lane Change.
2. In the Output Prefix text box, enter iso2.
3. Select OK.
Comparing Analysis Results
You now create a plot to compare the analysis results from the baseline vehicle assembly with the analysis results from the modified vehicle assembly.
In addition to the plots defined in the plotting configuration file, you will review the vehicle velocity. The Driving Machine longitudinal controller acts on the throttle demand to maintain the vehicle at the desired speed.
To compare the analysis results:
1. Launch Adams PostProcessor.
2. From the Plot menu, select Create Plots.
3. In the Analyses text box, enter the iso1.ilc and iso2.ilc analyses.
4. Right-click the Plot Configuration File text box, and search your private database for iso_lane_change.plt.
5. Select Cross Plotting.
6. Select OK.
Adams PostProcessor displays a plot of the roll angle versus lateral acceleration.
The new spring property file has a linear stiffness of 225 N/mm versus the 125 N/mm of the original spring files. A stiffer spring reduces the roll angle of the vehicle, effectively modifying the handling behavior and the ride comfort of the vehicle.
To create a plot of the longitudinal velocity versus time:
1. Select the New Page tool.
2. From the Request list, select chassis_velocities.
3. From the Component list, select longitudinal.
4. Set the Independent Axis to Time.
5. Select Add Curves.
Adams PostProcessor displays the plot you just defined.