Running a Swept-Sine Analysis
In this section, you perform a simulation using a basic ride input: a vertical swept-sine displacement disturbance of the tires.
Opening the Assembly
You first open the assembly on which you will perform the analysis.
To open the assembly:
1. From the File menu, point to Open, and then select Assembly.
2. Right-click the Assembly Name text box, point to Search, and then select <aride_shared>/assemblies.tbl.
3. Double-click Vehicle_full_4post_PAC2002.asy.
4. Select OK.
Setting up the Analysis
Now that the assembly is open, you are ready to set up the analysis.
To set up the analysis:
1. From the Ride menu, point to Full-Vehicle Analysis, and then select Four-Post Test Rig.
The Full-Vehicle Assembly text box displays the name of the assembly, Vehicle_full_4post_PAC2002.
2. Enter the following specifications:
■Output Prefix: swept_heave
■End Time: 10
■Mode of Simulation: interactive
■Basis for Number of Output Steps: min. number of outputs per input
■Target Value for Basis: 20
To prevent errors caused by aliasing, sample outputs at a minimum of six times the highest input frequency. A ratio of ten is much better than six; 20 is very good. Never use a ratio less than six.
Adams Car Ride automatically fills in the values under Actual Values Used for Simulation.
■Actuation Type: displacement
■Input Source: swept sine
■Input Locations: beneath tires
■Vehicle Constraint: no constraint
■Start Frequency: 0.0
■End Frequency: 20
■Displacement Amplitude: 10 mm
■Excitation Mode: heave
■Active Actuators: all
3. Select Apply.
The simulation will take a few minutes. Each pad under the tires gets the same displacement: a sine wave of 10 mm amplitude that varies linearly from 0 to 20 Hz in frequency over the 10-second simulation time.
4. When the simulation finishes, close the Message Window.
Viewing the Analysis Results
You can now view the analysis results in Adams PostProcessor.
To view the analysis results:
1. From the Review menu, select Postprocessing Window, or press F8.
2. In the dashboard, set Source to Result Sets.
3. From the Result Set list, select chassis_accelerations.
4. From the Component list, select vertical.
5. Select Add Curves.
Adams PostProcessor displays the plot as shown next (we’ve added the ovals to point out the peaks):
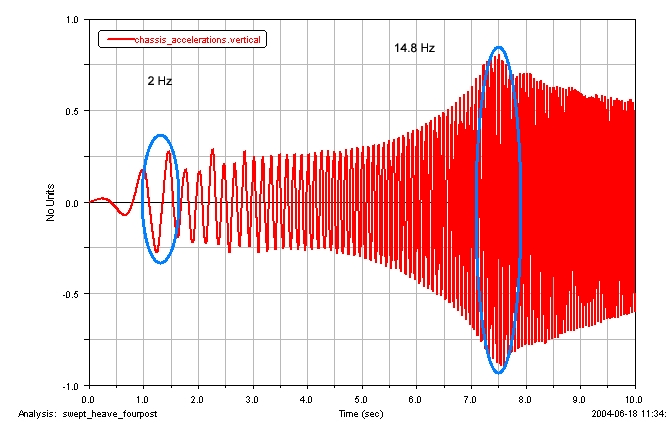
Note the slight peaks in the vertical acceleration amplitudes at about 1.5 seconds and 7.5 seconds. The peaks correspond to input frequencies at about 2 Hz and 14.8 Hz, and show the resonance of the vehicle for the body and suspensions, respectively.
6. To return to Adams Car Ride, press F8.