Simulating a Rough Road
In this section, you set up the four-post test rig to accept inputs stored in RPC III file format. You also generate a road profile using a mathematical model, and store it in an RPC III file. Then, you use the road profile you generated to stimulate the vehicle using the four-post test rig.
To learn about RPC III files, see the online help for Adams Durability.
Creating a Road-Profile Data File
To create a road-profile data file:
1. After you’ve returned to Adams Car Ride, ensure that the Full-Vehicle Analysis: Four Poster Testrig dialog box is still open. If it is not, open it as you did in Setting up the Analysis.
2. Specify the following:
■Output Prefix: rprof
■End Time: 5
■Basis for Number of Output Steps: output frequency
■Target Value For Basis: 20 Hz
■Adams Car Ride automatically fills in the values under Actual Values Used for Simulation.
■Actuation Type: displacement
■Input Source: road profiles
■Input Locations: beneath tires
■Vehicle Constraint: no constraint
3. Select Set Up Road Profiles.
Adams Car Ride opens the Road-Profile Setup: Four Poster Testrig dialog box.
4. Set Profile Source to RPC files.
5. Set Vehicle Speed to 100 km/h.
Adams Car Ride displays the time lag. This is the time that the disturbances for the rear wheels lag behind those of the front.
6. Right-click the File Name text box for either wheeltrack, point to Search, and then select <aride_shared>/road_profiles.tbl.
The Select File dialog box displays two files:
■example.rsp - File created with the Adams Car Ride Road Profile Generation tool.
■flat.rsp - Represents a road with zero height. You could use this file if you want one side of the car to not be excited by an RPC input.
■For this tutorial, we recommend that you make your own road-profile data file using the Road-Profile Generation tool.
7. Select Cancel to close the Select File dialog box. You can leave the other dialog boxes open.
8. From the Ride menu, point to Tools, and then select Road-Profile Generation.
9. Enter the following specifications:
■Elevation PSD Parameter: Ge: 0.1
■Velocity PSD Parameter: Gs: 20
■Acceleration PSD Parameter: Ga: 0.1
10. Accept the default values for Profile Length, Sample Interval, and Correlation Baselength.
11. Right-click the Output Filename for RPC III File text box, point to Search, and then select your private database.
12. Double-click the folder road_profiles.tbl.
13. In the File name text box, enter tut_road.rsp.
14. Select Open.
In the Output Filename for RPC III File text box, Adams Car Ride displays the full path to the file you just created: mdids://private/road_profiles.tbl/tut_road.rsp.
15. Select OK.
Note: | When creating a road profile as described above, the RPC III file will contain road height as function of travelled distance. When setting the 'Input per wheel' checkbox, an RPC III file can be specified for each wheel. However, this RPC III file is supposed to have road height as function of time. |
Setting up the Test Rig and Analysis
To set up the test rig and the analysis:
1. Return to the Road-Profile Setup dialog box.
2. Right-click the File Name text box for either wheeltrack and search your private database for the file you just created, tut_road.rsp
3. Repeat the previous step for the other wheeltrack.
4. For the Left Wheeltrack Profile, set Channel Number to 1.
Note: | The Road-Profile Generation tool always makes a file with two channels. You could use either one for the left or right wheeltrack, but, by convention, channels 1 and 2 are labeled LElev and RElev, for left and right elevation, respectively. To obtain symmetrical input, you can use the same channel number for both wheeltracks. |
5. For the Right Wheeltrack Profile, set Channel Number to 2.
6. Select OK.
The four-post test rig is now set up for the road profile you just created.
7. On the Full-Vehicle Analysis dialog box, select Apply.
The simulation will take a few minutes.
Viewing the Analysis Results
You can now view the analysis results in Adams PostProcessor. First you will view an animation and then you will look at the profile that causes the vehicle behavior you saw in the animation.
To view the analysis results:
1. Start Adams PostProcessor just as you did in Viewing the Analysis Results.
2. From the View menu, select Load Animation.
3. Double-click rprof_fourpost.
4. Use the Dynamic Rotate tool  to view the vehicle from a front corner.
to view the vehicle from a front corner. 5. Select the Play tool  .
.
.The vehicle vibrates in response to the profile inputs. Depending on the seed for the pseudo-random number generator used in the Road-Profile Generation tool (by default the seed is based on the computer’s clock), you may see the vehicle drift up or down, as if driving over a slight hill.
6. From the View menu, select Load Plot.
7. From the File menu, point to Import, and then select RPC File.
8. Right-click the File to Read text box and search for the file you created in Creating a Road-Profile Data File tut_road.rsp
9. Select OK.
10. From the Channel list, select both LElev and RElev.
11. Select Add Curves.
Adams PostProcessor displays a plot similar to the one shown next.
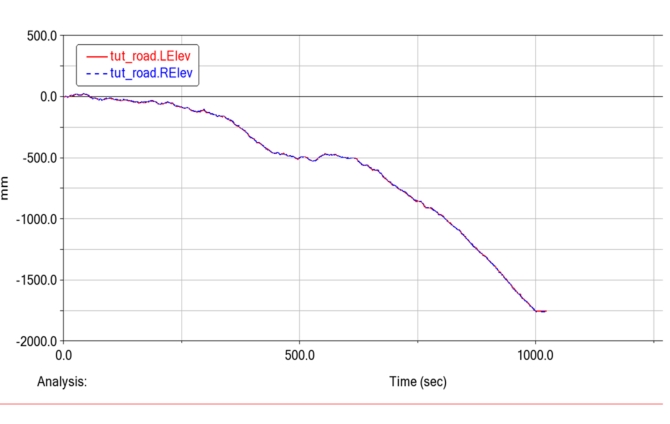
With the parameters Ge=0.1, Gs=20, and Ga =0.1, you should see the LElev and RElev channels appear to be very similar on a large distance scale. If, however, you zoom in, you will see that they are very different. This is because, as with a real road, the low-frequency content of the wheeltracks is well correlated, but the high-frequency content is not. Note that your road might look different because it was probably generated with a different random-number seed than the one shown above.
12. Return to Adams Car Ride.