Plotting System Modes
In this section, you plot the system modes to determine which system modes in the sensitive frequency range contribute to amplification of launch loads.
To plot system modes:
1. Click the Plugins tab on the Adams View ribbon.
2. From the Vibration container, click Vibration tool  → Review → Postprocessing or press F8.
→ Review → Postprocessing or press F8. Adams View launches Adams PostProcessor, a postprocessing tool that lets you view the results of simulations you performed. Take a minute to familiarize yourself with Adams PostProcessor. For more information about Adams PostProcessor, see the Adams PostProcessor online help.
Figure 1 shows the Adams PostProcessor window.
Figure 1 Adams PostProcessor Window
3. In the dashboard, set the Source to System Modes.
4. From the Simulation list, select vertical_analysis.
5. From the Eigen list, select EIGEN_1.
6. Select Add Scatters.
Adams PostProcessor plots system modes. The scatter plot should look as shown in Figure 2.
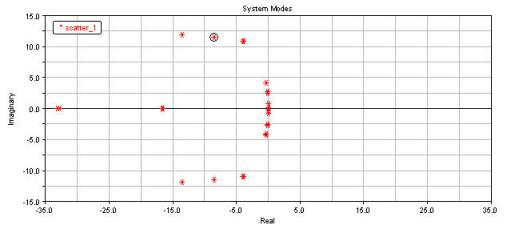
Figure 2 Scatter Plot
7. On the Curve Manager toolbar, select the Plot Tracking tool  . Move your cursor over one of the plotted modes. Notice how the real and imaginary values for the mode are displayed on top of the plot.
You can also zoom in on the scatter plot to view details for -5.0, 0.0 on the real axis and -15.0, 15.0 on the imaginary axis.
These lightly damped, low-frequency modes are the modes you are most concerned with for the payload_adapter design; they tend to influence the amount of energy transmitted from the launch vehicle into the satellite.
8. Turn off plot tracking by selecting the Plot Tracking tool again.
9. In Adams Postprocessor create a new page by selecting the New Page tool  .
.
. 10. From the Adams Postprocessor main menu, click Vibration → Review → Create Scatter Plot with Eigen Table.
The scatter is plotted with a table of eigenvalues as shown in Figure 3 below.
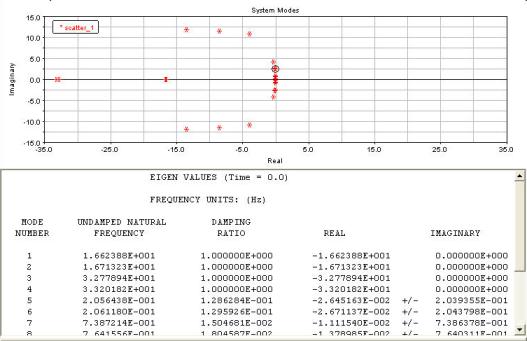
Figure 3 Scatter Plot with Table