Plotting Force Frequency Response
In this section you plot the frequency response from the lateral force input.
To plot frequency response magnitude in dB and log scale:
1. Select the New Page tool.
2. From the pull-down menu located below the File menu, select Plotting.
Adams PostProcessor switches to plotting mode.
3. Set Source to Frequency Response.
4. From the Vibration Analysis list, select lateral_x.
5. From the Input Channels list, select input_x.
6. From the Output Channels list, select p1_corner_x_acc.
7. Select Magnitude.
8. Select Add Curves.
9. From the Output Channels list, select ref_x_acc.
10. Select Add Curves.
Adams PostProcessor plots the frequency response magnitude.
Note that there is an amplification of the input around .76 Hz and between 3.5 Hz and about 5.8 Hz, but an attenuation of the input for frequencies above 5.8 Hz. You can check this by comparing the reference input with the output.
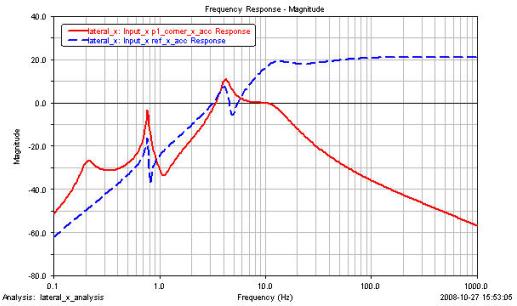
Figure 1 Frequency Response Plot
From the frequency response functions, it is clear that the input becomes attenuated above about 5.8 Hz (see Figure 1). Therefore, any accelerations that come through the test base into the payload adapter will be sharply attenuated by the bushings connecting the payload adapter with the satellite bus.