Performing an Adams View Automatic Design Study Analysis
You will now perform a design study with the help of the Adams View design study tool. In this exercise, you will look for the effect of the translational damping value on the absolute maximum of the frequency response measured between the input channel input_x and the output channel p1_corner_x_acc. To do this you will learn:
■Reviewing Parameterization
■To define the Adams View objective for the use with an Adams Vibration analysis:
■To create a simulation script
■To specify that the results from each run are to be stored
■To run a design evaluation analysis based on an Adams Vibration simulation event
■To evaluate results of the design study
■To plot the frequency response in a three-dimensional plot
Reviewing Parameterization
In this section, you’ll investigate the parameterization set up for the bushing damping. You’ll then define the range over which the design variable will be varied.
To review parameterization of the model:
1. Return to the modeling mode by selecting the Adams View tool.
2. From the Tools menu, select Database Navigator.
3. In the pull-down menu next to Filter, select Forces.
4. Select Satellite to display all forces in the model.
5. Select BUSHING_1, and then select APPLY.
The Information window displays information about BUSHING_1. Notice the parameterization of the bushing damping using the design variable trans_damp.
6. Return to the Database Navigator and filter on Variables.
7. Select trans_damp, and then select APPLY to display information on this design variable.
8. In the Information window, double-click percent_damping in the expression for trans_damp.
Information on the design variable appears in the information window.
9. In the Information window toolbar, select Modify.
The Create/Modify Design Variable dialog box appears as shown in Figure 1.
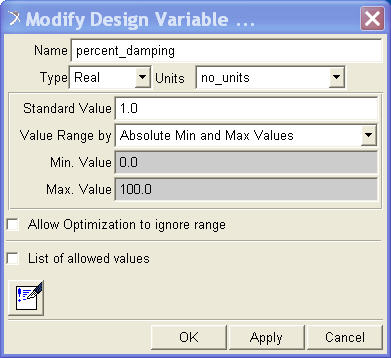
Figure 1 Design Variable Settings
10. To define the range over which the design variable will be varied, specify the following:
■Standard value: 1.0
■Min. Value: 1.0
■Max. Value: 20.0
11. To save your selection, select OK.
12. Close the Information Window and the Database Navigator (if it is still open).
Defining the Adams View Objective
In this section, you’ll define a return value to track the value of the objective for each simulation.
To define the Adams View objective for the use with an Adams Vibration analysis:
1. Click the Plugins tab on the Adams View ribbon.
2. From the Vibration container, click Vibration tool  → Improve → Vibration Design Objective → New.
→ Improve → Vibration Design Objective → New. The Create Vibration Design Objective Macro and the Create Design Objective dialog boxes appear.
3. In the Create Design Objective dialog box, enter Max_FRF in the Name text box.
4. In the Create Vibration Design Objective Macro dialog box, right-click the Return Value Variable text box, point to Variable, and then select Create.
The Create Design Variable dialog box appears.
5. Set Standard Value to 0.0.
6. Accept the remaining defaults of the Create Design Variable dialog box, and then select OK.
This variable will be used as the return variable to track the value of the objective for each simulation.
7. From the Target Vibration Data list, select Frequency Response: 1 input, 1 output.
8. Right-click the Input Channel text box, point to Input_Channel, point to Guesses, and then select input_x.
9. Right-click the Output Channel text box, point to Output_Channel, point to Guesses, and then select p1_corner_x_acc.
10. Set Value Type to Maximum.
11. Set Frequency Range to All Frequencies.
12. Select OK to create the vibration design objective macro.
Adams Vibration automatically fills in the text boxes in the Create Design Objective dialog box with the reference to the return variable DV_1 and the macro MACRO_1, created by Adams View, to calculate the design objective for every simulation as specified.
13. Select OK in the Create Design Objective dialog box.
Creating a Simulation Script
Here you create the simulation script for the model.
To create a simulation script:
1. From the Vibration container, click Vibration tool → Test →Create Multi-Run Script.
→ Test →Create Multi-Run Script. The Create Vibration Multi-Run Script dialog box appears.
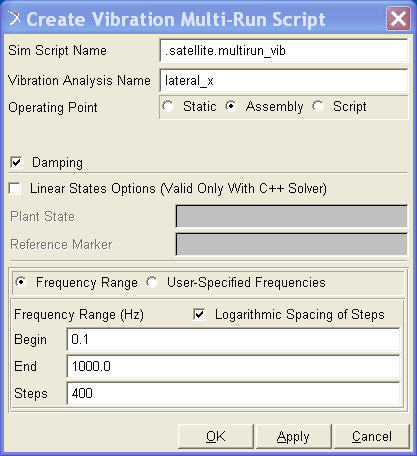
Figure 2 Create Vibration Multi-Run Script Dialog Box
Storing Results
Here you tell Adams View where to store the results.
To specify that the results from each run are to be stored:
1. From the Settings menu, point to Solver, and then select Output.
2. Complete the dialog box as shown in Figure 3. Be sure to select More to expand the dialog box to the form shown.
3. Select Close.
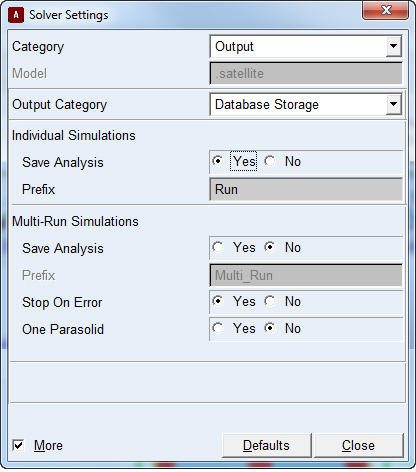
Figure 3 Solver Output Settings
Running a Design Evaluation Analysis
Now that you’ve defined the objective, the design variable values, and the script, you can run a design evaluation analysis.
To run a design evaluation analysis based on an Adams Vibration simulation event:
1. From the Vibration menu, point to Improve, and then select Design Evaluation.
2. Right-click the Simulation Script text box, point to Simulation Script, point to Guesses, and then select .multirun_vib.
3. Set Study a to Objective.
4. Right-click the Objective text box, point to Objective, point to Guesses, and then select max_FRF.
5. Accept the default setting of Design Study.
6. Right-click the Design Variable text box, point to Variable, point to Browse, and then select percent_damping.
7. Confirm that Default Levels is set to 5.
8. Select Start to initiate the design study.
After the design study analysis runs, Adams Vibration generates a plot indicating the maximum of the selected FRF for the five different cases.
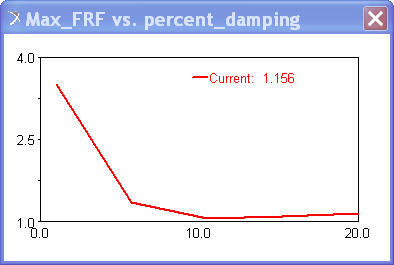
Figure 4 Design Objective Strip Chart
Evaluating the Results of the Design Study
To evaluate results of the design study:
1. In Adams PostProcessor, select the New Page tool.
2. In the Vibration analysis text box, select all analyses from lateral_x_1 to lateral_x_5.
3. Set Input Channel to Input_x.
4. Set Output Channels to p1_corner_x_acc.
5. Select Add Curves to create the plot.
A multi-curve plot appears as shown in the figure below.
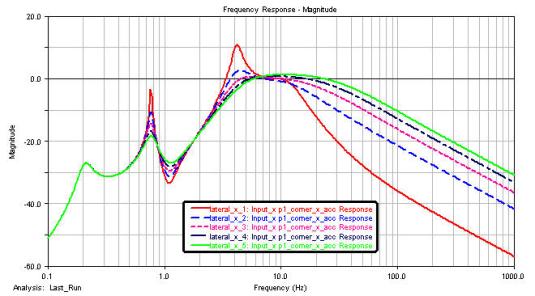
Figure 5 Response for Design Study
To plot the frequency response in a three-dimensional plot:
1. Select the New Page tool.
2. From the pull-down menu located below the File menu, select Plot3D.
3. In the Vibration Analysis text box, select all analyses from lateral_x_1 to lateral_x_5.
4. Set Input Channels to Input_x.
5. Set Output Channels to p1_corner_x_acc.
6. Select Add Surface to create the three-dimensional plot.
7. To shade the 3D plot, select the Wireframe/Shaded tool  .
.
. 8. Click on the legend, and in the property editor, set Placement to Left.
The plot appears as shown in Figure 6.
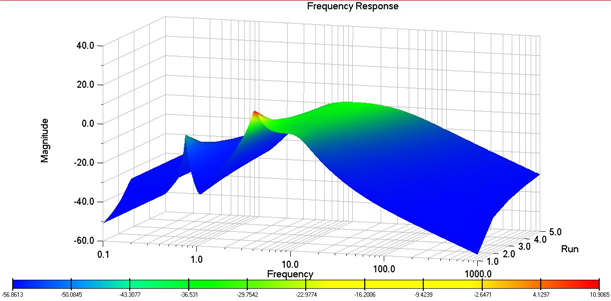
Figure 6 Three-Dimensional Plot of Design Study