Creating a Plot Using Physical Test Data
You can now take the two measures created by your physical data, and use them to create a plot for comparison.
To create a plot using physical test data:
1. Click the Results tab on the Adams View ribbon.
2. From the Postprocessor container, click Postprocessor tool or press F8.
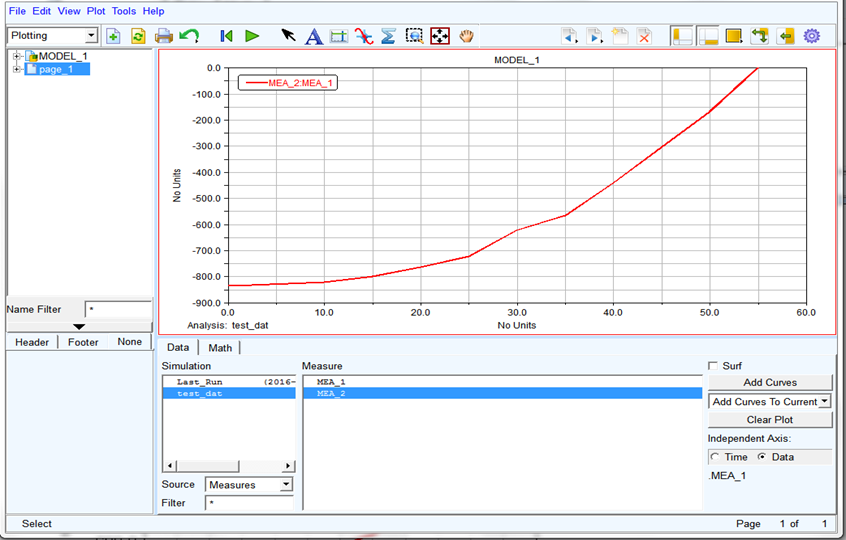
or press F8. Adams View launches Adams PostProcessor (see Figure 1), a post-processing tool that lets you view the results of simulations you performed. Adams PostProcessor has several modes, including plotting (default), animation, and report, as shown in the first pull-down menu on the menu toolbar.
Take a minute to familiarize yourself with Adams PostProcessor. For more information, see the Adams PostProcessor online help.
Figure 1 Adams PostProcessor
3. At the bottom left of the dashboard, set Source to Measures.
4. From the Simulation list, select test_dat.
5. At the bottom right of the dashboard, set Independent Axis to Data.
A browser, named Independent Axis Browser, appears. It lets you select data for the horizontal axis.
6. Select MEA_1.
7. Select OK.
8. From the dashboard, from the Measure list, select MEA_2, for the vertical axis data.
9. Select Add Curves to add the new data to the plot.
Adams PostProcessor displays the plot of x against y as shown next:
.