In Adams PostProcessor
Acoustics Dialog
In Adams PostProcessor click on the "Acoustics" menu, then the Generate Acoustic Analysis Plots button to launch the post processing dialog for acoustics analyses.
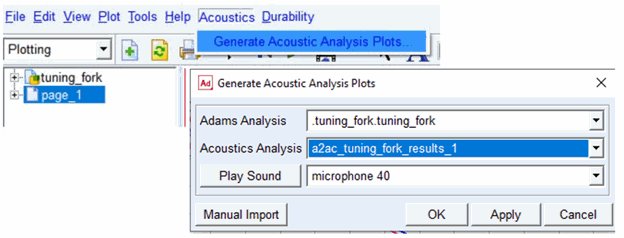
■Adams Analysis: Select from a list of Adams analyses in the session
■Acoustics Analysis: If the selected Adams analysis has one or more acoustics analyses based upon it, they will appear here. Select the one for which plots should be generated
■Play Sound: Any microphones for which an audio file was generated by the selected acoustics analysis will appear in this option menu. Select one and click the "Play Sound" button and the corresponding .wav audio file will play through the system's default media player.
Note: | 1. Generation of .wav files is only available for time domain simualtion 2. Tip for getting good audible .wav file: The quality of the DFT can be reassured with the Nyquist criteria, fmax = 1/(2  t), with t), with  t the time step and fmax the maximal computed frequency for the DFT. However, for an audio file of high quality the Nyquist criteria is not sufficient. It is suggested to have 5 to 20 times more time steps for the same maximal frequency, thus 1/(20 t the time step and fmax the maximal computed frequency for the DFT. However, for an audio file of high quality the Nyquist criteria is not sufficient. It is suggested to have 5 to 20 times more time steps for the same maximal frequency, thus 1/(20 t) t) |
■Manual Import: This is primarily for users wanting to generate plots for acoustic simulations from the preceding "Adams2Actran" toolkit form MSC Services. It can also be used, though, as a means to generate plots from acoustic simulations not currently in session. Click this button to browse for an .a2ac file corresponding to an acoustics analysis.
■OK/Apply: This will launch automated plotting of the selected acoustics analysis. The automated plots that get generated are described in the following sections.
Time Domain Analysis Plots
The Generate Acoustic Analysis Plots dialog will automatically create the following plots for a time domain acoustics analysis:
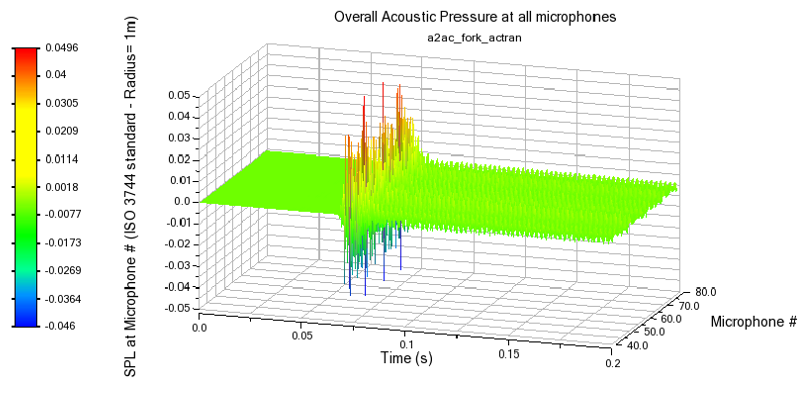
■Sound Pressure Level (SPL) vs. Time across all Microphones (page name: "acoustics_time_all_mic_SPL_transient") - Typically this plot is used to identify the microphones with the highest relative pressure results.
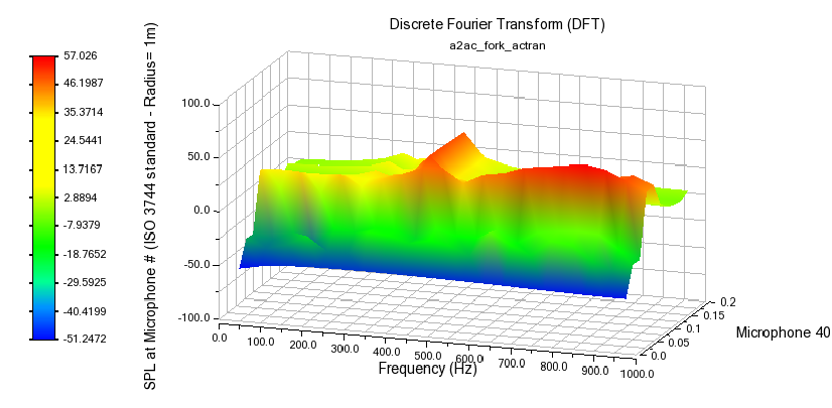
■Sound Pressure Level (SPL) vs. Frequency across Time Slices at Each Microphone (page name: "acoustics_time_DFT_mic_#") - a page/plot is created for each microphone selected on the Far Field Tab.
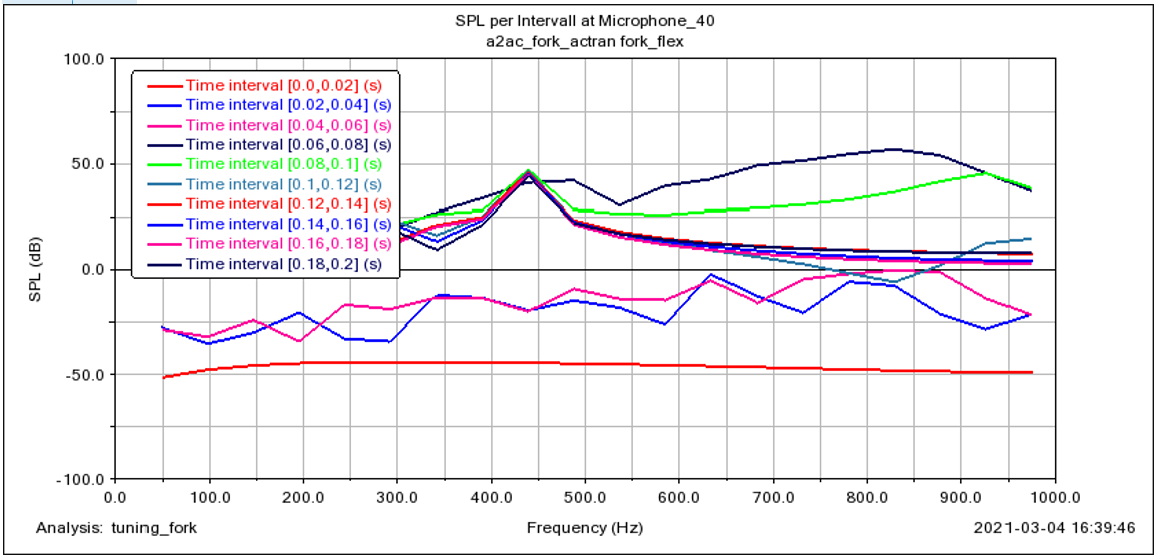
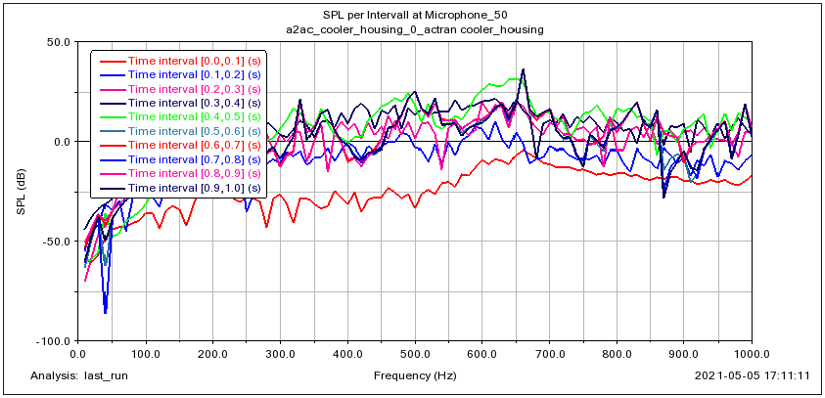
■Sound Pressure Level (SPL) vs. Frequency at Each Time Interval (page name: " acoustics_time_SPL_per_time_interval_mic_40#") - a page/plot is created for each microphone selected on the Far Field Tab.
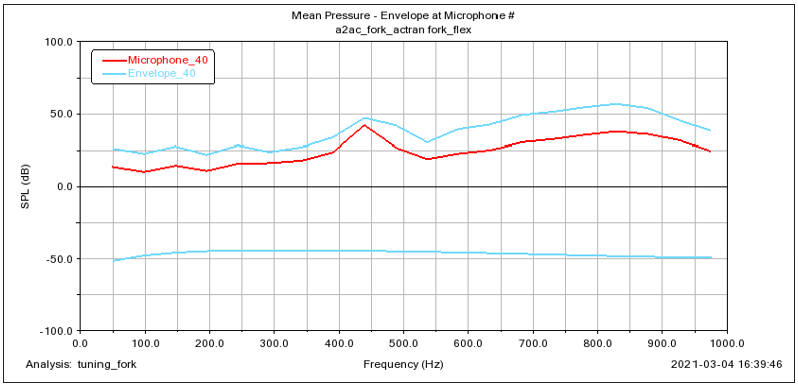
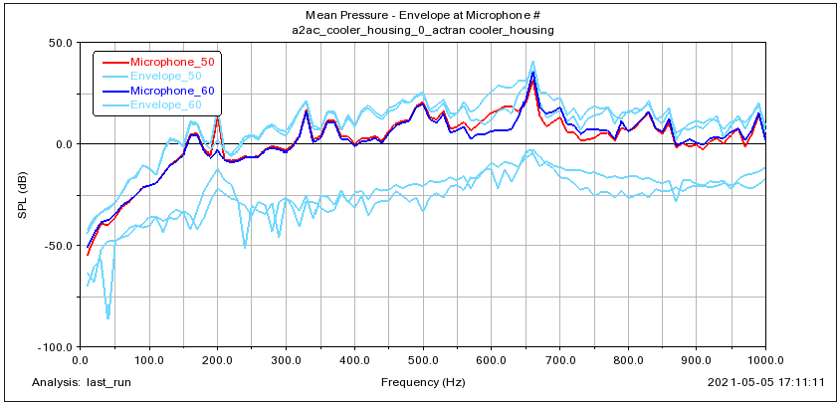
■Mean Pressure and Envelope at Each Microphone (page name: "acoustics_time_mean_pressure") - three curves, a mean and upper and lower bounds (envelope), are created for each microphone selected on the Far Field Tab.
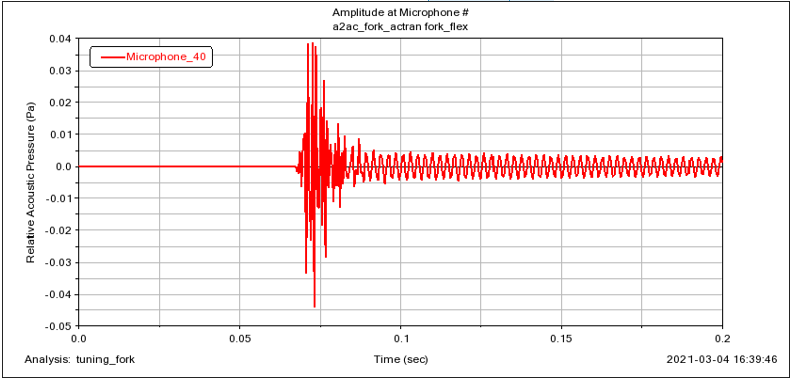
■Amplitude at Each Microphone (page name: "acoustics_time_amplitude") - a curve on the plot is created for each microphone selected on the Far Field Tab.
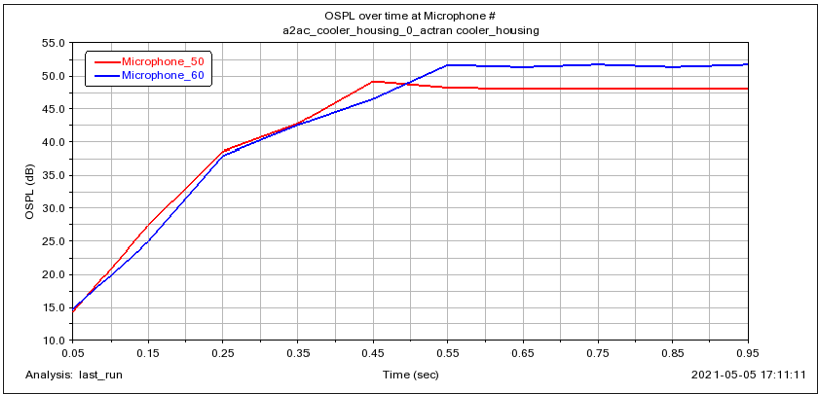
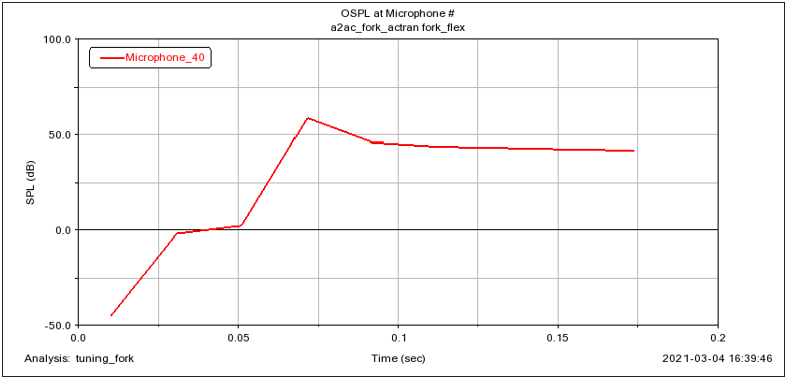
■Overall Sound Pressure Level (OPSL) at Each Microphone (page name: "acoustics_time_overall_SPL") - a curve on the plot is created for each microphone selected on the Far Field Tab.
Frequency Domain Analysis Plots
The Generate Acoustic Analysis Plots dialog will automatically create the following plots for a frequency domain acoustics analysis:
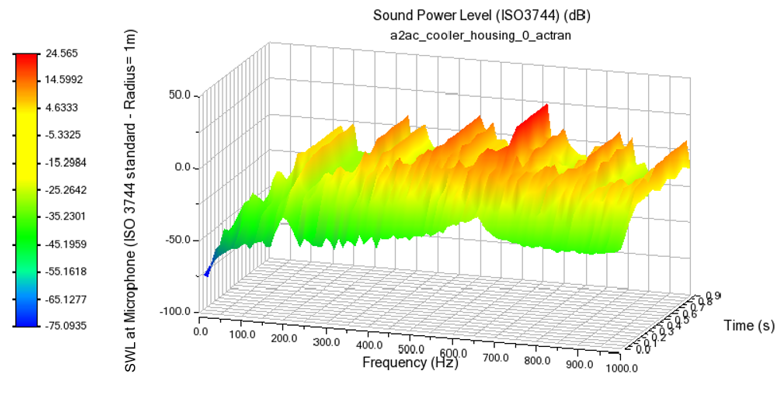
■Sound Power Level (SWL) vs. Frequency across Time Slices (page name: "acoustics_freq_SWL") - the time slices are those selected from the Adams analysis
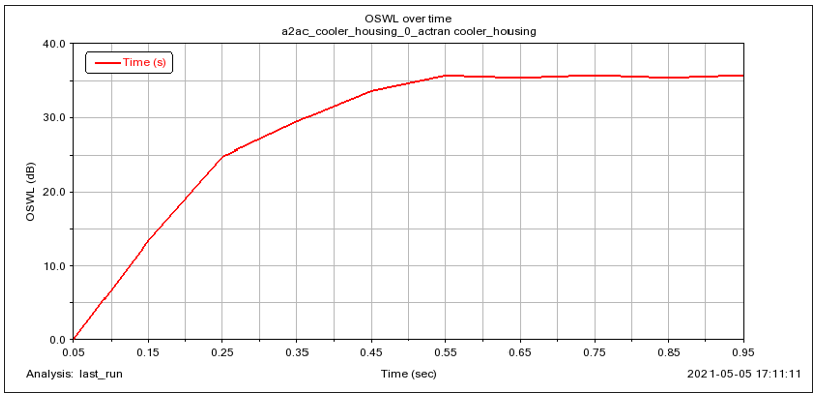
■Overall Sound Power Level (SWL) vs. Time (page name: "acoustics_freq_overall_SWL")
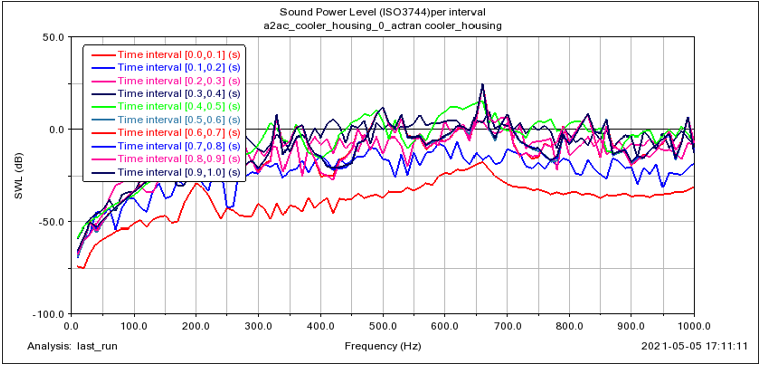
■Sound Power Level (SWL) vs. Frequency per Time Interval (page name: "acoustics_freq_SWL_per_time_interval") - a separate curve is plotted for each time interval use from the Adams analysis
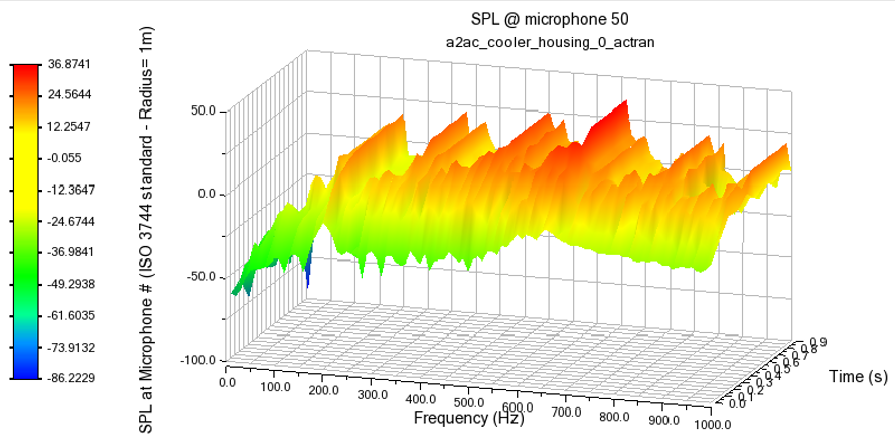
■Sound Pressure Level (SPL) vs. Frequency across Time Slices at Microphone (page name: "acoustics_freq_SPL_at_mic#") - #") - a page/plot is created for each microphone selected on the Far Field Tab.
■Sound Pressure Level (SPL) vs. Frequency at Microphone (page name: "acoustics_freq_SPL_per_time_interval_at_mic#) - a page/plot is created for each microphone selected on the Far Field Tab; curves are plotted per plot for each time interval
■Mean Pressure and Envelope at Each Microphone (page name: "acoustics_freq_mean_pressure") - three curves, a mean and upper and lower bounds (envelope), are created for each microphone selected on the Far Field Tab.
■Overall Sound Pressure Level (OPSL) at Each Microphone (page name: "acoustics_freq_overall_SPL") - a curve on the plot is created for each microphone selected on the Far Field Tab.