Working with Results
Overview
This chapter guides you through reviewing the results of your analysis; fitting your data to a polynomial to determine which factors most affect model performance; and publishing results to an HTML or SYLK file.
The sections in this tutorial are:
Reviewing Results
After Adams Car completes the trials defined in your design matrix, you return to Adams Insight interface to view the results.
To return to Adams Insight:
1. From the main menu in Adams Car, point to Simulate, point to DOE Interface, point to Adams Insight, and then select Display and Modify.
The Adams Insight Display dialog box appears.
2. Verify the name of your experiment, and then select OK.
Adams Car undisplays and the Adams Insight window opens.
To view your simulation results:
■In the treeview, under Design, select Work Space.
Simulation results from Adams Car appear in the design matrix as shown in Figure 9.
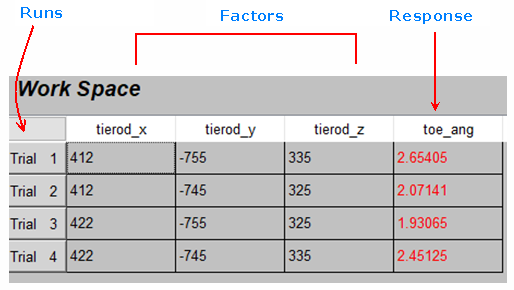
Figure 9 Work Space Matrix After Running Trials in Adams Car
■In the treeview, under Design, select Work Space Review.
The Work Space Review offers another means of reviewing the raw data found in the work space.
Fitting Results
Now that Adams Car has completed the trials defined in your work space matrix, you can use Adams Insight to fit your results to a polynomial or a response surface. The purpose of fitting your results is to establish a relationship between the factors and responses that you selected for the work space matrix. Fitting results includes a multiple regression. You will be able to investigate the parts of the regression in the Summary, located in the treeview under Analysis, after completing the following steps. For more information on this topic, refer to the Adams Insight online help.
To fit your results:
1. From the Adams Insight toolbar, select the Fit results tool  . You can also select the Tools menu, and then select Fit New Model.
. You can also select the Tools menu, and then select Fit New Model.The Model Properties Summary window appears. Here, you can enter information on your model.
2. In the Regression column, select the response, toe_angle_objective.
3. In the Display column, select the type of results you want to view. For example, Figure 10 shows an example of the Fit table.
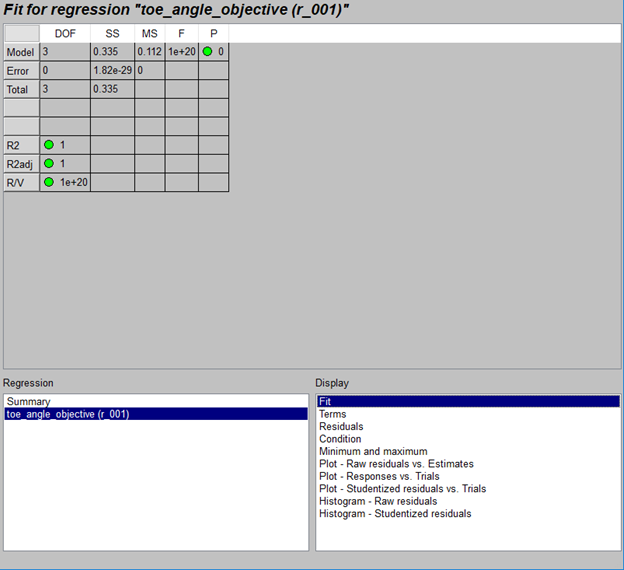
Figure 10 Results Table with Fit for Regression
For definitions of the items in the results table, see online help.
The tables also provide you with a color code that indicates the soundness of your results:
 Green indicates that all fit criteria meet or exceed highest fitting thresholds
 Yellow indicates that the fit criterion may bear investigation
 Red indicates that the fit criterion should be investigated
Publishing Results
Adams Insight lets you save your findings as either HTML or SYLK files. Once saved, you can use either a browser or spreadsheet program, such as Excel, to modify factors and see the effect on responses without performing full simulations.
To publish your results:
1. In the treeview, under Analysis, select Model_01, and then go to the Adams Insight toolbar, and select the Export to Web, SLK, etc. tool  . You can also select the File menu, point to Export, and then select Model. In the window that opens, set the File Type to HTML File.
. You can also select the File menu, point to Export, and then select Model. In the window that opens, set the File Type to HTML File.The Save dialog box appears and prompts you to save your results as xxx.htm, where xxx is the name of your file.
2. Enter a name for your file and specify the path where you would like it to reside, and then select Save.
Adams Insight saves your file in the directory that you specified.
3. Continue with the next section, Modifying Values Using a Web Browser, to learn how to view and use the results in the HTML file.
Modifying Values Using a Web Browser
Using the HTML page that you saved (see 1. through 3., above), you can modify the input factor values of your experiment and see the changes instantly reflected in the column that lists estimated responses. To learn more about making modifications to your experiment using an HTML or SYLK pages, refer to the Adams Insight online help.
To modify your factors in an HTML page:
1. In a Web browser, open the HTML page you created for your experiment. Make certain the browser you use is able to read JavaScript.
The results of your experiment appear as shown in Figure 11.
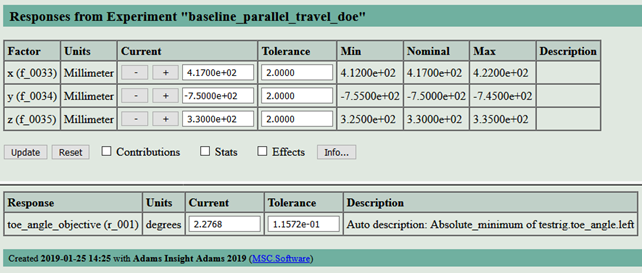
Figure 11 HTML Results Page
2. Change the value for the first factor hpl_tierod_outer.x from 417 to 420, and then select Update.
The estimated responses adjust to reflect the new factor values. Notice that the value for the response, toe_angle_objective, reflects a change.
3. You can continue to vary the factor values and investigate how changes to them affect your responses. To learn more about analyzing the results of your experiment and publishing your results to HTML or SYLK pages, refer to the Adams Insight online help.
Additional Information on the Web Page
In addition to the basic factor and response information that appears when you first open the HTML file in your Web browser, you can view response statistics and response effects as a function of each factor. To view this information, use the check boxes below the list of factors.
Note: | The check boxes only appear if you specified the corresponding data in your experiment. For example, if you didn’t specify tolerances for your factors, the Contributions check box will not display. |
The check boxes are:
■Contributions - This check box appears if you specified tolerances for any factor. When present and selected, this check box displays the Tolerance Contributions table that provides the percent contribution of each factor to the tolerance of each response.
■Stats - Displays R2, R2 adjusted, P, and R/V statistics for each response.
■Effects - For each response, displays effects caused by varying each factor from its minimum to maximum value.
■Nonscalar - Displays composite responses in addition to the scalar responses.
■Plots- Opens a new window that displays a plot for each composite response (providing you specified composite responses).
■Info - This button displays a separate window that provides summary information about the investigation parameters for the current page. It also provides Web environment information that is valuable if you need to contact Adams technical support.
For more information on the controls and information provided by the HTML page, refer to the Adams Insight online help.
Adams Insight Interface
This section describes what you see when Adams Insight first opens. Figure 3 shows the main window as it appears when you first launch Adams Insight. It includes the following items:
■Menu bar - Contains pull-down menus for File, Edit, Define, Simulation, Tools, and Help.
■Toolbars - Contain commonly used tools for accessing files, creating and modifying designed experiments.
■Treeview - Displays a hierarchical list of objects that you can include in an experiment. The tree is especially useful for selecting and identifying objects when you are creating a design matrix.
■Viewport - The area of the window that displays parameters for modifying the objects you select from the treeview.
■Status bar - Displays messages and issues prompts during your Adams Insight session.
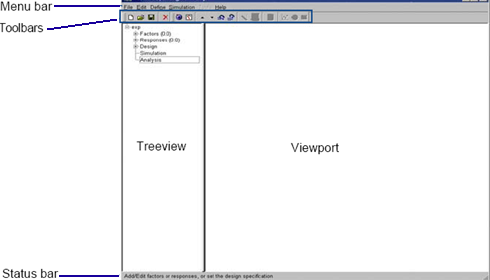
Figure 12 Adams Insight Main Window
Adams Insight Toolbars
The Adams Insight main window has four toolbars:
■Main (Experiments) toolbar - Lets you execute basic commands.
■Adams Insight (Experiments Contents) toolbar - Helps you build and execute your experiment.
■Work Space toolbar - Lets you execute commands on the work space.
■Report toolbar - Lets you generate and export a report.
If you hold your mouse pointer over any tool, tip text appears giving a short description of the tool.
Tools in toolbars are arranged in the order that you’ll use them in the process of creating and executing your designed experiment. Depending on where you are in the process of creating an experiment, Adams Insight enables or disables the tools (you can always display and undisplay them if you need to). This feature alerts you to the correct order of procedures to follow. For example, the Run simulations tool is disabled until you define required elements for a design matrix.
For more information on the toolbars, see the Adams Insight online help.