Single
The Single option in Adams/PostProcessor displays the percentage of torque and speed distribution at the described range of time during the gear operation. It can be launched as shown in Figure 438
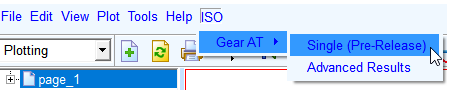
Figure 438 Launch Single
It performs the KISSsoft Export and calculate the gear pair in background via KISssoft, if available. The calculation is based on a template calculation including various settings of KISSsoft. This file can be edited by advanced users and can be found in the installation directory of Gear AT (install_dir\2021_0\gear_at\python\iso_calc\template\template.Z12). A reduced results file is created and re-imported into Adams/PostProcessor for review. In addition, the used three-dimensional field of history loads is shown as 3D-Plot. This allows the user to refine the area of investigation.
Important: | A full installation of KISSsoft has to be available on the same machine. |
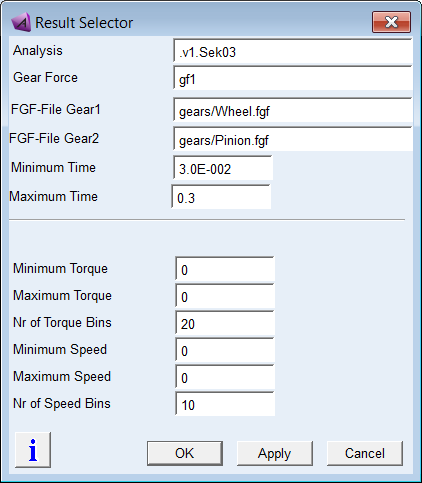
Figure 439 Load Single
Select the analysis result and the Gear AT Force Element that has to be sent to the KISSsoft.
The gear design data of the Gear 1 and Gear 2, which is retrieved from FGF files, is exported to KISSsoft for quasi-static analysis. Define the time range of the simulation that is needed to be analyzed by entering the fields Minimum Time and Maximum Time.
The interested torque and speed range can be defined by Minimum Torque and Maximum Torque, Minimum Speed and Maximum Speed parameters, respectively. That allows to neglect the numerical noise of the torque. The Nr of Torque Bins and Nr of Speed bins are the percentage sets of torque/speed values that are outputted as the result blocks over the complete time.
The bins are created as three-dimensional fields. Every result consists of a torque value and a speed value. A bin is defined by the average speed and average load in this bin. The result belonging to this range is put in this bin, meaning, that the duration of this bin is increased by the time span of this result occurrence.
In sum, all durations of all bins shall be 100% of the total investigated simulation time (i.e. from Minimum Time to Maximum Time).
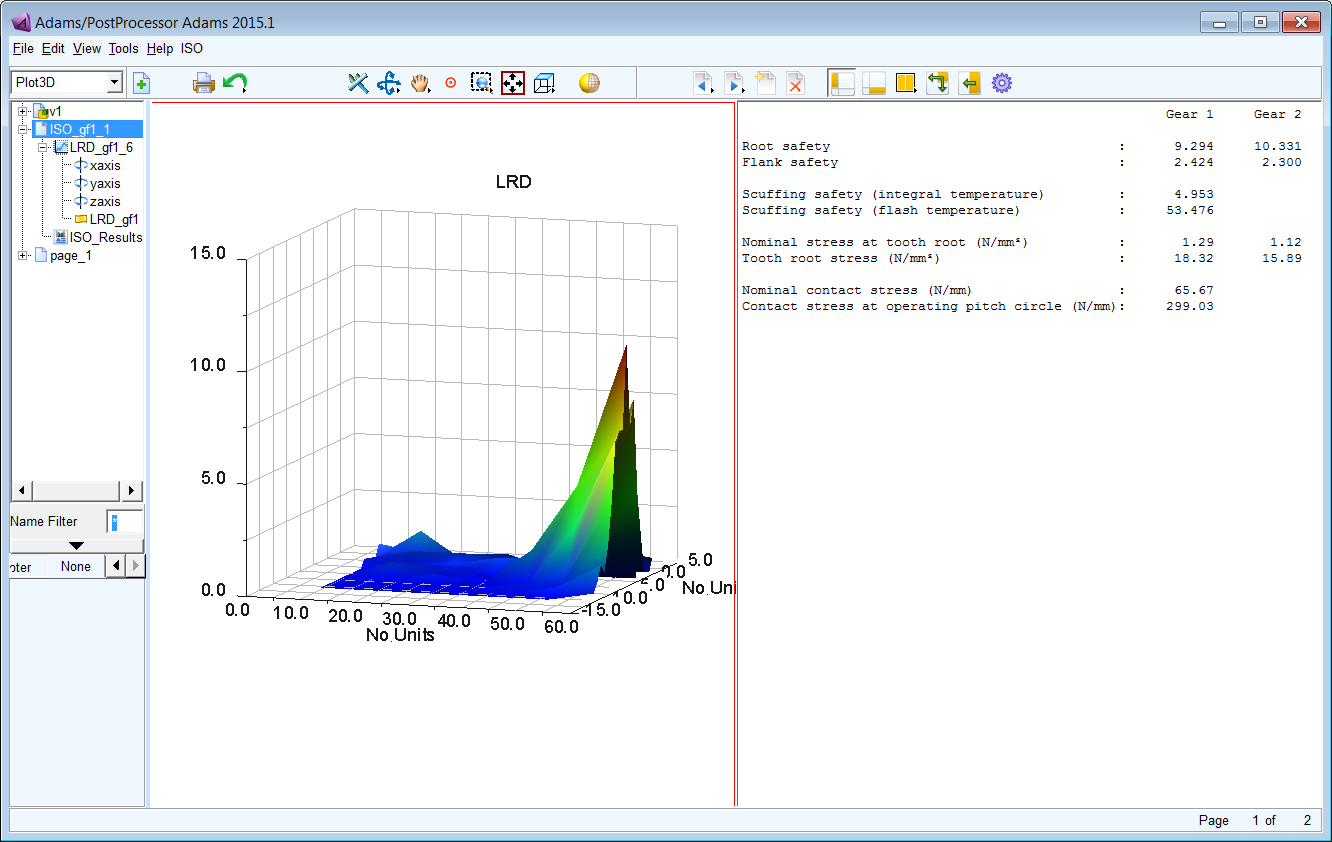
Figure 440 Single Display
You can load the plots for the Load Rotation Distribution. The X-axis of the plot gives the percentage of the torque or speed within the complete load time frame. The Y-axis is the value of the torque or speed. KISSsoft Standard Results can also be loaded.
Important: | Set Minimum Torque = Maximum Torque to determine the minimum and maximum values from the results over requested time range. Set Minimum Speed = Maximum Speed to determine the minimum and maximum values from the results over requested time range. |
Note: | The KISSsoft Export tool is still under development. It’s outside the warranty and Hexagon doesn’t guarantee correct results. Support is not provided for this tool. Error handling isn’t implemented at high level. |