Example of Using User-Defined Measures in a Model of a Pendulum
Overview
The following example demonstrates how to use user-defined measures and illustrates some of the useful capabilities of measures. In the example, you import an Adams View command file that builds a model of an ideal pendulum. The simple mathematical model of the ideal pendulum assumes the following:
■The link defining the pendulum has no mass or inertia.
■The sphere is a point mass.
■There is no friction in the revolute joint.
■The pendulum oscillates through a small angle.
You will then create an object measure and a user-defined analytical solution to measure the pendulum’s kinetic energy. After simulating the model, you will use another user-defined measure to compare the two kinetic energy measurements.
We’ve provided you with three command files that you can use depending on how much of the example you want to do yourself:
■test_measures_without.cmd - Model with no measures defined.
■test_measures_with.cmd - Model with two of the four required measures.
■test_measures_final.cmd - Model with all four required measures.
The files are in the directory /install_dir/examples/user_guide, where install_dir is the directory in which Adams software is installed.
The example is divided into the following sections:
Importing the Command File
To import the command file to create a simple pendulum:
1. Copy the command file test_measures_without.cmd to your local directory.
Note: | By default on Windows, files in the installation directory are read-only. During installation, your system administration can choose to change the permissions so you can write to the installation directory. If this has not been done, you will need to change the permissions of the above file when you copy them to your working directory. |
2. Start Adams View, and then import test_measures_without.cmd.
You should see the model, shown on the next page, in your modeling window.
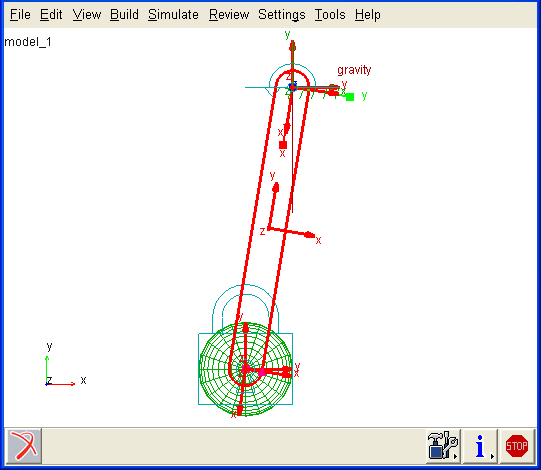
Figure 9 Simple Pendulum
Creating an Object Measure of Kinetic Energy
The following steps describe how to measure the kinetic energy of a pendulum.
1. Right-click the sphere part, and select Measure.
2. In the Part Measure dialog box, change the name of the measure to Adams_KE.
3. From the Characteristic option menu, select Kinetic Energy.
4. Select OK.
A strip chart titled Adams_KE appears. Because you have not run a simulation, the chart contains no information.
Creating a User-Defined Analytical Measure
The following steps describe how to build an analytical measure for kinetic energy. You will use an Adams Solver function measure because you can conveniently use the Adams Solver variable time to parametrize the equation.
Here is a brief review of the mathematical model for kinetic energy of a pendulum. The last portion of the equation divides by 1000 to convert from millimeters to meters.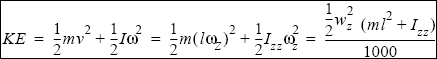
To build a function measure:
1. Click the Design Exploration tab. From the Measures container, click the Function Measure tool  .
.
.or
(Classic interface) From the Build menu, point to Measure, point to Function, and then select New.
The Function Builder appears.
2. Change the function measure name to .model_1.MY_KE.
3. Type the following lines into the work area of the Function Builder:
0.5*wz(.model_1.PART_2.cm)**2*(15*(50**2 + 300**2) + 15000)/1000
Note: | The Function Builder can only process 80 characters per line. To avoid any problems, use multiple lines to input the kinetic energy expression. |
4. Select OK.
A strip chart titled MY_KE appears. Because you have not run a simulation, the chart contains no information.
5. Run an interactive dynamic simulation for 2.0 seconds with 50 steps (the default). Watch the feedback of both measures.
Both plots should appear similar in period and magnitude. If not, double check the syntax of your function.
Creating a User-Defined Comparison of the Measures
The following steps describe how to build a measure comparison of the analytic and Adams kinetic energy results. You use an Adams View computed measure because the information is already stored in the measures .model_1.ADAMS_KE and .model_1.MY_KE.
1. Click the Design Exploration tab. From the Measures container, click the Range Measure tool  .
.
.or
(Classic interface) From the Build menu, point to Measure, point to Range, and then select New.
2. Change the name of the range to MY_AVERAGE. Then, select the range type Average, and specify the measure of .model_1.MY_KE.
3. Select OK.
A strip chart titled MY_AVERAGE appears. You do not need to run another simulation because the strip chart already contains useful information based on the last simulation.
4. From the Build menu, point to Measure, point to Computed, and then select New. The Function Builder appears.
5. Change the name of the computed measure to .model_1.PERCENT_ERROR.
6. Type the following line into the working area of the Function Builder:
100*(.model_1.ADAMS_KE - .model_1.MY_KE)/322.6
7. Select OK.
A strip chart titled PERCENT ERROR appears. You do not need to run a simulation because the strip chart should already contain useful information. Remember that if you make any significant changes to the model, these results are no longer valid.
You should see that the maximum percentage of error between the two curves is less than 3%.