Performing a Single Lane-Change Analysis
Now that you opened a full-vehicle assembly, you can submit a single lane-change analysis.
Performing a single lane-change analysis involves the following:
Setting Up the Analysis
You can now specify the inputs for the full-vehicle analysis and perform a single lane- change maneuver. A single lane-change maneuver inputs a one-cycle sinusoid to the steering wheel with the cycle length (time) and maximum steer value (amplitude) you enter.
To set up the analysis:
1. From the Simulate menu, point to Full-Vehicle Analysis, point to Open-Loop Steering Events, and then select Single Lane Change.
2. Fill in the dialog box as shown next, and then select OK.
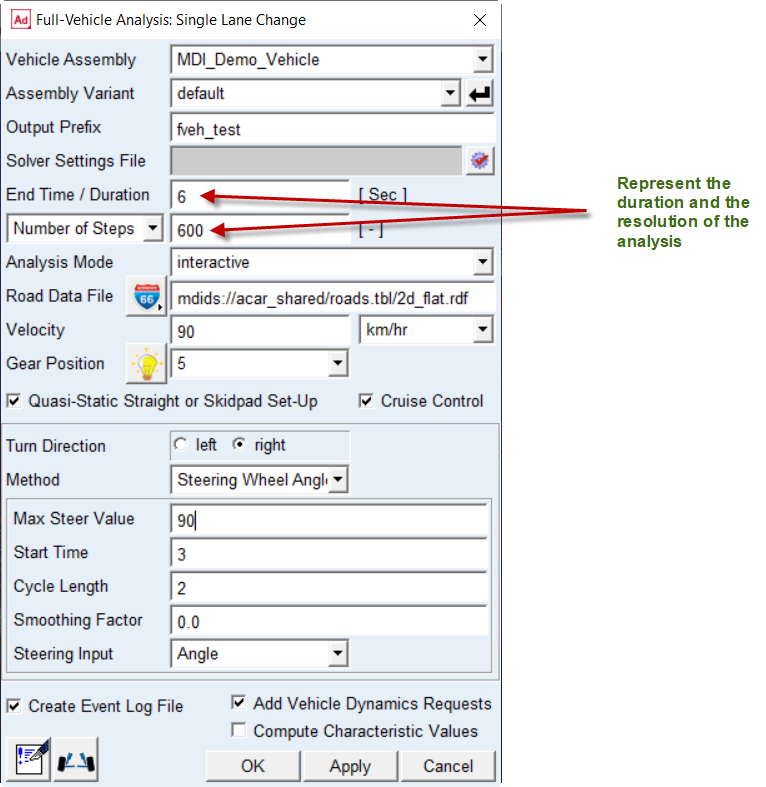
Adams Car updates the force entities, such as dampers, springs, and bushings, with the values specified in their property files and sets up the vehicle assembly for the maneuver. Setting up the vehicle assembly includes adjusting the road height so the road is in contact with the tires and deactivating certain motions and forces, depending on the type of steering input you selected and the inputs you specified. For example, because you set the steering input to angle, Adams Car deactivates the torque on the steering wheel and the force on the rack, and activates a motion on the steering wheel revolute joint.
The test rig, which is part of the assembly, applies the inputs you specified in the analysis submission dialog box to the assembly, and performs a static analysis, followed by a dynamic analysis.
3. When the analysis is complete, select Close.
You are now ready to animate and plot the results.
Animating the Results
In this section, you view the analysis you just ran. Adams Car has already loaded the analysis results files for you.
Before you animate, you might want to change the magnification of your assembly so you can see the path the vehicle is taking.
To change the magnification of your assembly:
1. When the cursor is in the center of the main window, type a lowercase z.
2. Hold down the left mouse button, and do either of the following:
■To enlarge the display of the assembly, or zoom in, move the cursor up.
■To shrink the display of the assembly, or zoom out, move the cursor down.
3. To exit zoom mode, release the mouse button.
4. Animate the results just as you did in Animating the Results.
5. If you want the vehicle to always be in the center of the screen, do the following:
■In Review pull down menu, select Animation Controls, Toggle Fixed Base to Base Part.
■Right-click the text box under Base Part, point to body, and then select Browse.
■The Database Navigator appears.
■From the list under MDI_Demo_Vehicle, double-click TR_Body, and then double-click ges_chassis.
6. If you want to see the path the vehicle takes, do the following:
■Toggle No Trace to Trace Marker.
■Right-click the text box under Trace Marker, point to Marker, and then select Browse.
■The Database Navigator appears.
■Double-click TR_BODY.
■Double-click ges_chassis.
■Double-click cm.
7. To run another animation with either of the options presented in Steps 5. or 6., select the Play tool.
Adams Car animates the vehicle.
8. To return the assembly to its initial configuration, select the Reset tool  .
.
.Plotting the Results
In this section, you create two plots that represent the following:
■Vehicle lateral acceleration as a function of time
■Roll angle of the vehicle as a function of the lateral acceleration
To create a plot of the lateral acceleration with respect to time:
1. From the Review menu, select Postprocessing Window.
2. Verify that Source is set to Requests.
3. From the Simulation list, select fveh_test_sin.
4. From the Filter list, select user defined.
5. From the Request list, select chassis_accelerations. You might have to scroll to see this option.
6. From the Component list, select lateral.
7. Set the Independent Axis to Time.
8. Select Add Curves.
Adams PostProcessor displays the plot you requested, as shown next:
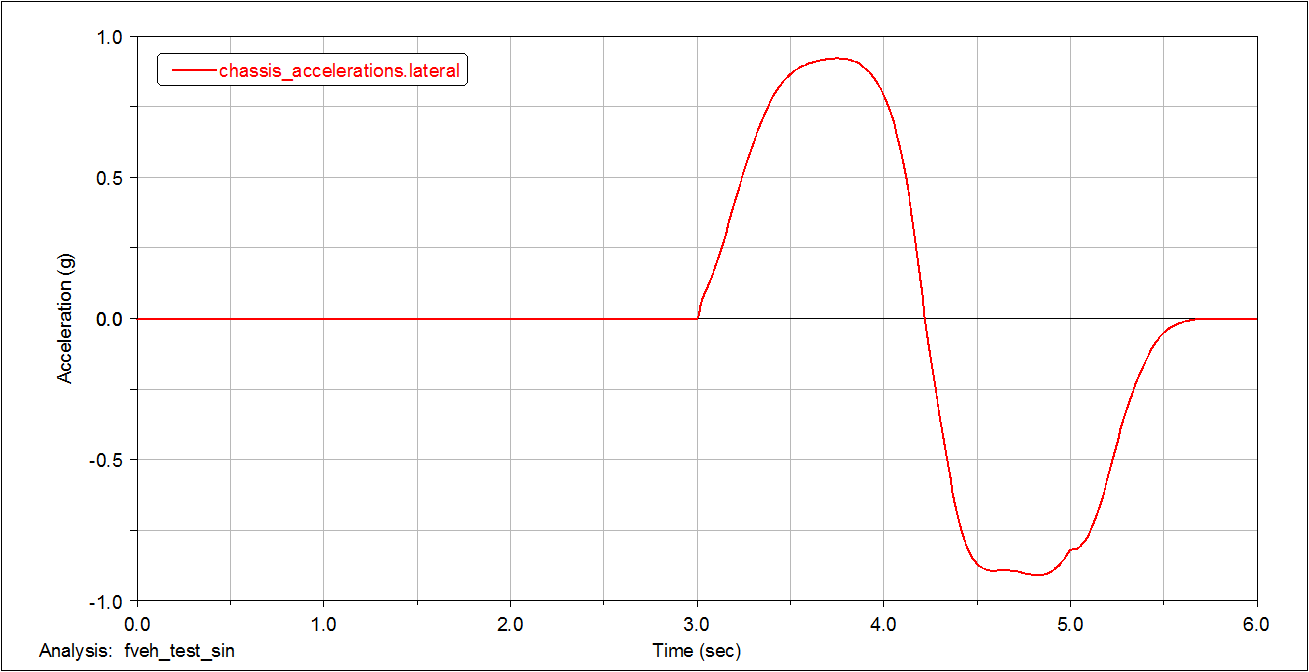
Figure 2 Plot of Lateral Acceleration versus Time
To create a plot of the roll angle with respect to lateral acceleration:
1. From the Request list, select chassis_displacements.
2. From the Component list, select roll.
3. Set the Independent Axis to Data.
The Independent Axis Browser appears. You perform the next four steps in the browser.
4. From the Filter list, select user defined.
5. From the Request list, select chassis_accelerations. You might have to scroll to see this option.
6. From the Component list, select lateral.
7. Select OK.
8. From the dashboard, select Clear Plot.
9. Select Add Curves.
Adams PostProcessor displays the plot you requested, as shown next:
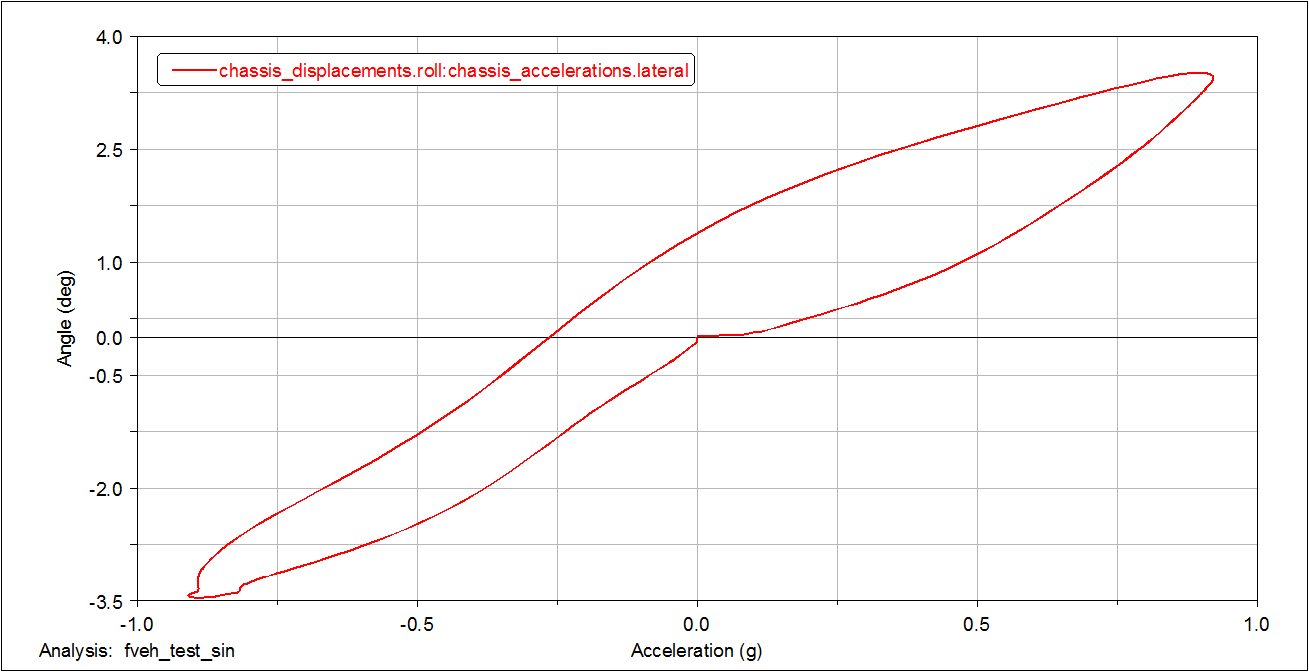
Figure 3 Plot of Roll Angle versus Lateral Acceleration
Modifying Plot Layouts
To make a plot ready for a report, you can assign a title or subtitle to the plot, just as you did in Plotting Steering Wheel Torque versus Steering Wheel Angle.
To assign a title or subtitle:
1. Assign the following title to your plot: Roll Angle versus Lateral Acceleration.
2. Assign the following subtitle to your plot: plot1.
3. Return to Adams Car.