Advanced Results
There is option available to display 3D plots of various results distributed over the tooth flanks that were in contact over specified time range of interest. It can be accessed from ISO menu as shown in Figure 441
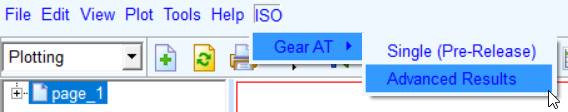
Figure 441 Access of Advanced Results
Following type of results is available for 3D plotting:
■Minimal Oil Film Thickness
■Maximal Friction Power
■Maximal Contact Pressure (Contact Pattern)
Important: | This postprocessing option is not available for the Gear FAST contact modeling option. It is only valid with the Rigid Gear, Flexible Tooth and Full Flex Gear. |
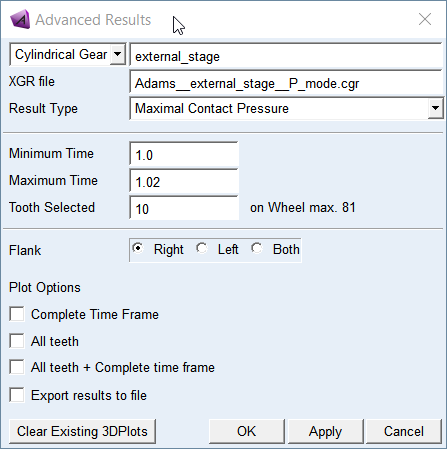
Figure 442 Plotting Advanced Results
You can only plot results like Contact Patterns, Oil Film Thickness and Friction Power of the Gear 1 for the Gear AT Force of interest. To create 3D plot of results distribution you need to select a gear force, browse for the gear results file (*.xgr), define the time range of interest from the range of simulation time, select the tooth number and side of the gear tooth flank - Right (Minus), Left (Plus) or Both based on plots of results (Figure 442 and Figure 443). Please note, the default for the minimum and maximum time are set based on the latest simulation stored in the database, what can be different to the content of *.xgr file.
To learn more about *.xgr file name convention and how to activate or deactivate output of the files, see Output Settings.
Important: | Use button Clear Existing Plots with care as it clears up all plots including 2D plots in addition to 3D plots of advanced results! |
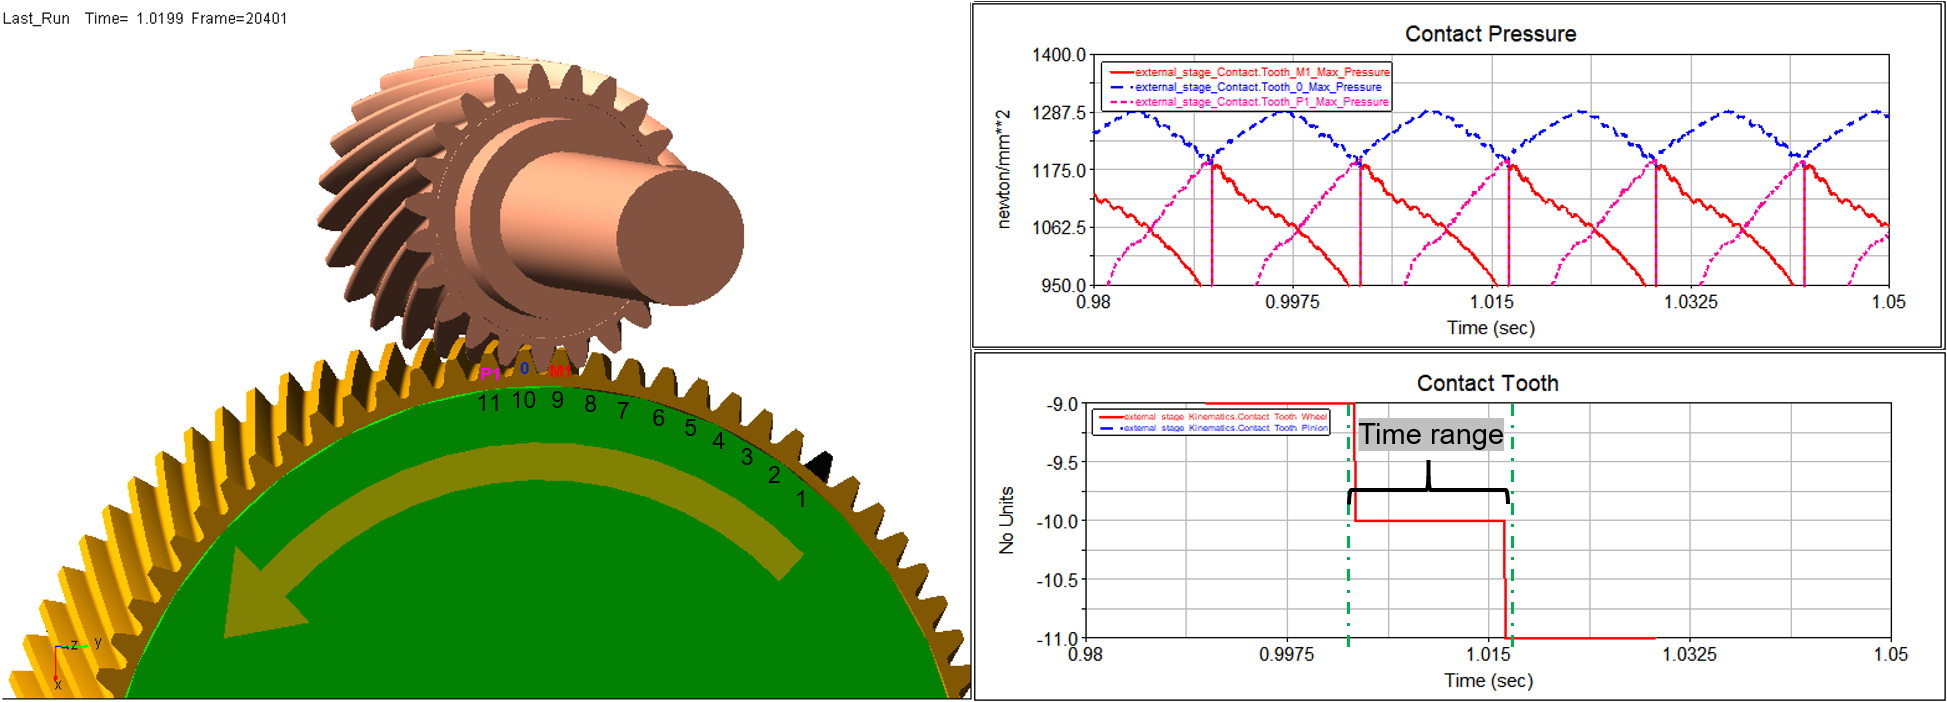
Figure 443 max. contact pressure on the contact tooth
All plots are listed on the left side of Adams/PostProcessor window in the treeview toolbar. Select the required tooth to display respective 3D plot of results as shown on Figure 444.
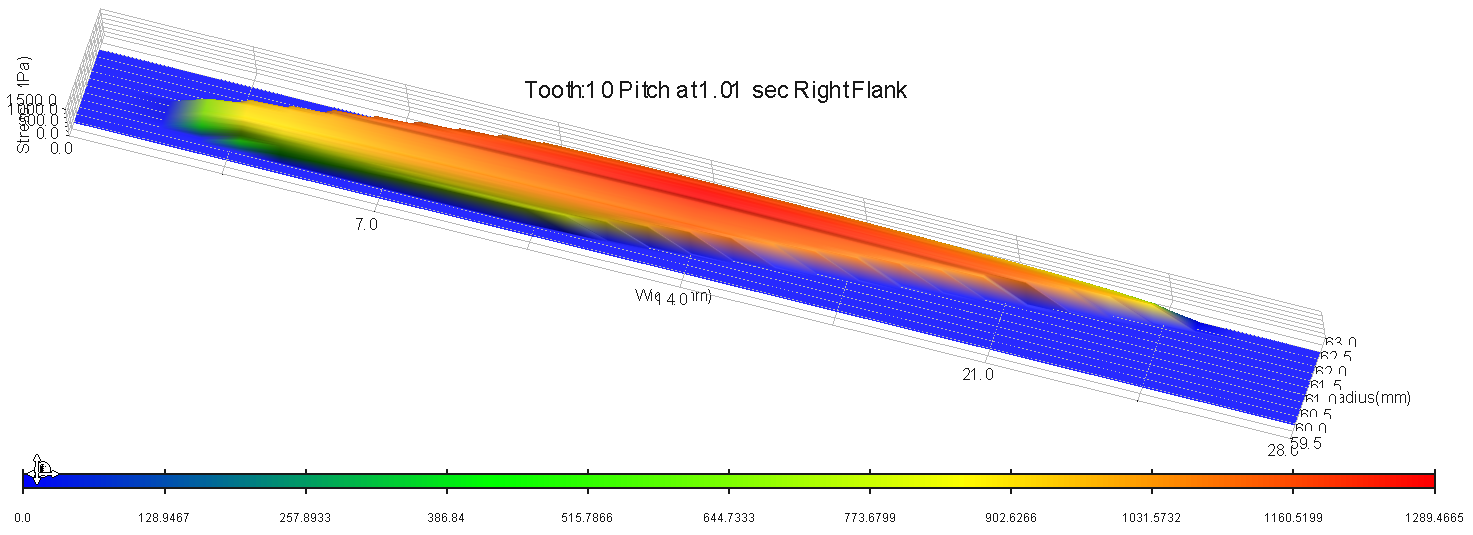
Figure 444 Result of Contact Pattern
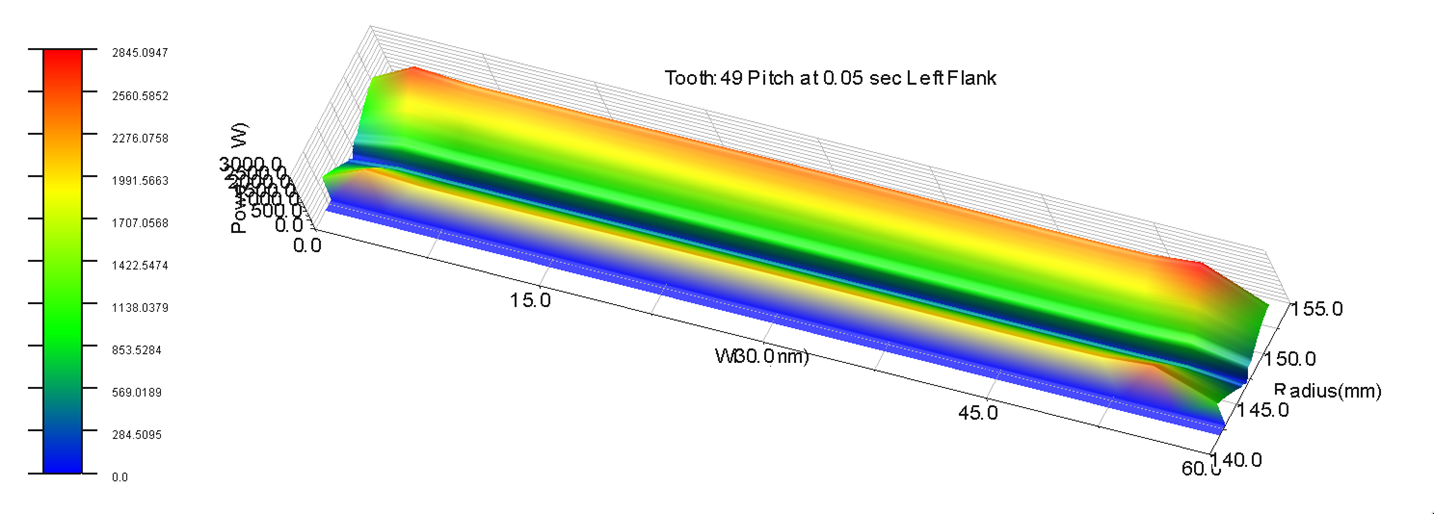
Figure 445 Results of friction power
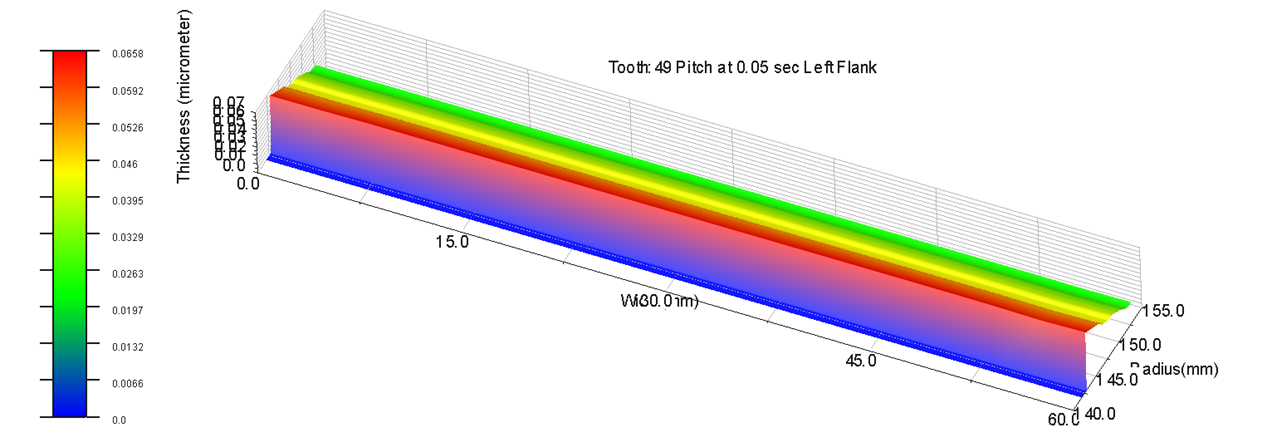
Figure 446 Results of oil film thickness
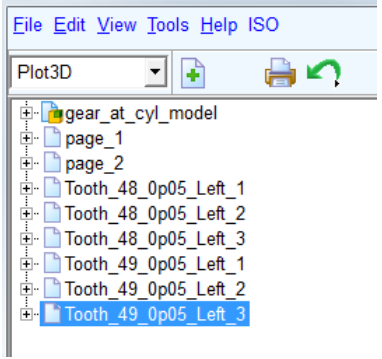
Figure 447 Treeview of 3D plots in Adams Postprocessor
The name of the tooth in the treeview is in the form Tooth_49_0p05_Left_3, where:
■Tooth_49 - tooth number
■0p05 - mean value of specified output time range (0.05 sec)
■Left_3 - flank side and unique plot number (Minus - right flank, Plus - left flank)