Animating Flexible Bodies and Adams Durability Results
Learn more about animating flexible bodies and Adams Durability results:
Caching of Flexible Bodies
When you select to animate a model containing flexible bodies, Adams PostProcessor creates a flexible body cache file (*.fcf) that contains the animation data for the flexible bodies. By creating a cache file, Adams PostProcessor reduces the memory usage required when animating models with flexible bodies, while maintaining peak animation performance.
You can change the type of caching and set other preferences as explained in PPT Preferences - Animation.
The cache files (*.fcf) are stored on the disk (before animation starts in case of ‘Disk’ caching and before animation is deleted (or session is closed or *.res file is exported) in case of ‘Memory’ caching). If a result file (*.res) is written or a database/session is exported after the animation is run, the *.res file or *.bin file will have reference to these cache files stored on the disk. In a new session, when the result file or *.bin file (saved database/session) is imported and the animation is re-run without any changes, the cache files saved on the disk will be reused to run the animation, thus saving the time to regenerate the cache data. However, if there is any change in the simulation or model then new cache files will be generated when running the animation.
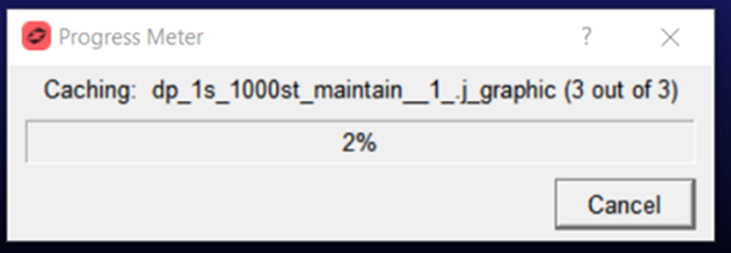
When a flex body is cached in ‘Run Cache’ mode, a progress meter is shown to let the user know that a flexible body deformation is being cached for animation. The progress meter will also indicate the total number of flex bodies that will be cached and which one is currently being cached.
Animating Only the Flexible or Stress Body
When animating flexible or rigid stress bodies, you can also select to only display the flexible or stress body and no other parts. The selected body appears without any of the translational or rotational information from the analysis. This allows you to focus in on contour plot information, as well as the hot spot information for both flexible and stress bodies. Also, with flexible bodies, this allows you to focus on a particular body and watch its deformations within the animation or analyze any color information.
To display only a flexible body:
2. Right-click the Component text box, and point to Flexible Body or Rigid Stress Body, and then use the menus to select a body to display.
Setting Animation Display Options for Flexible Bodies
You can set various animation options for flexible bodies, including scaling the deformation of a flexible body while it is being animated, setting the rendering of the flexible body, and setting the type of plot to display. Learn more about flexible body plots.
Also learn about:
■Setting the defaults for animations of flexible body deformations and display of vector plots with PPT Preferences - Animation
To set the animation options:
1. In the treeview, select the flexible body on which you want to set animation options.
3. Set the properties for the animation. (Learn more about the property editor for changing animation display with Property Editor - Flexible Body dialog box help.)
Animating Deformations, Modal Forces, and Stress/Strain
You can select to animate the deformations, modal forces (MFORCEs), or the stresses and strain acting on the flexible body as Contour plots or Vector plots. You can also animate both types of plots on the same flexible body.
Learn more about color contour and vector plots:
About the Data the Different Types of Plots Display
Depending on the Adams product you use to create and simulate your model, you display different types of data as contour or vector plots: deformations, stress/strain, or modal forces:
Data and Type of Plot
You can view: | As: | Using data from: |
|---|---|---|
Deformations | Contour plots | Adams Flex - When you analyze flexible bodies using Adams Flex, you can contour deformations using Adams View or Adams PostProcessor. |
Stress/Strain | Contour plots | Adams Durability - When you obtain stress and strain results using Adams Durability, you can use Adams PostProcessor to show the stress and strain on a body as contour plots. The stress or strain can be contoured on rigid or flexible bodies. For more on obtaining stress and strains, see the Adams Durability online help. |
Modal forces | Contour and vector plots | Adams View and Adams Flex - You can contour MFORCEs in Adams PostProcessor as both contour and vector plots. You can only view force or torque vectors as vector plots. For more information on MFORCES, see Modeling Distributed Loads and Predeformed Flexible Bodies. |
Kinetic/Strain | Contour plots | Adams Vibration – When you compute kinetic or strain energy distribution results using Adams Vibration, you can use Adams PostProcessor to display these as contours on flexible bodies in the model. These contours can be displayed during mode shape or vibration animation |
Strain SS | Contour plots | Adams Vibration – When you compute frequency response for models with flexible bodies, you use Adams PostProcessor to display the strain energy contours during a mode shape or vibration animation. This only applies if the .mnf files for the flexible bodies contain stress-strain modes. |
Displaying Plots
To display color contour or vector plots, you must first specify the flexible body on which you want to display the plots and which types of plots to display, and then turn on the plots.
Note: | You can also set the flexible body contour and vector plotting in Flexible Body Modify dialog box. See the Adams Flex online help. |
To turn on contour and vector plots for individual flexible bodies:
1. In the Treeview, select the flexible body on which you want to display plots.
2. In the Property Editor, set Plot Type to the appropriate type of plot (Contour, Vector, or Both).
To turn off the display of contour and vector plot for individual flexible bodies:
1. In the treeview, select the flexible body which is set to display plots.
2. In the property editor, set Plot Type to None.
To display a contour plot in a particular view:
1. From the dashboard, select Contour Plots.
2. From Plot Type, select a type of contour plot.
To display a vector plot:
1. From the dashboard, select Vector.
2. From Plot Type, select a plot.
Specifying a Deformation Datum Node
You can set the datum node for which you want deformations to be relative to. Adams PostProcessor considers the deformation to be relative to the origin of the flexible body (its local body reference frame (LBRF) or coordinate system) by default. For example, if you were modeling a cantilever beam in Adams Flex, you could specify that deformations should be relative to the clamped end.
To specify a datum node:
1. In the treeview, select the flexible body on which you want to display plots.
2. In the Property editor, in the Datum Node text box, enter the number of the desired node.
Note: | To select a node from the screen, right-click the Datum Node text box, and then select Pick Flexbody Node. Select the node from the screen. The node number appears in the Datum Node text box. |
3. Select OK.
Modifying Contour Legends
For each viewport, you can change the way contour plots display colors and values. Please note that this allows you to display different viewports at the same time but with different color values, which can be confusing because a color value in one viewport may not be the same as in another.
To turn off the legend:
■Clear the selection of Display Legend.
To modify the legend:
1. From Legend Placement, select where you'd like the legend to appear.
2. In the Legend Title text box, change the text of the legend title.
3. In the Colors text box, enter the number of colors to be displayed in the plot. There can be no more than 255.
4. In the Minimum and Maximum text boxes, enter the minimum and maximum values for the plot.
5. In the Decimal Places text box, enter the number of decimal places to which the numbers in the axes should be displayed.
6. In the Scientific Range text boxes, enter the exponential form for scientific notation. This controls the lower and upper powers of ten where the format for real numbers switches from a fixed point format to scientific notation. The default values are -4 and 5, meaning that any number less than or equal to 1.0E-04 or greater than or equal to 1.0E+05 will be written in scientific notation.
To reset the legend values based on the flexible bodies in the active view:
■Select Reset Limits.
Tuning the Performance of Flexible Body Animations
You can use the Animation Performance Tuning guide to help you improve the performance of the animation of flexible bodies. It steps you through all the options available in Adams PostProcessor. These same options are located throughout the Adams PostProcessor interface. It also provides tips on optimizing modal neutral files (MNFs) for best animation performance.
To run the Animation Performance Tuning guide:
1. From the Tools menu, select Animation Performance Tuning.
2. Follow the prompts and enter the values to improve the animation performance of flexible bodies.