Working with Results
Overview
This chapter guides you through reviewing the results of your analysis, fitting your data to a polynomial to determine which factors most affect model performance, and publishing results to an HTML or SYLK file.
The sections in this chapter are:
Reviewing Results
After Adams View completes the trials defined in your design matrix, you return to the Adams Insight interface to view the results.
To return to Adams Insight:
1. Click the Design Exploration tab on the Adams View ribbon.
2. From the Insight container, select Display icon  .
.
.The Adams Insight Display dialog box appears with the name of your current experiment.
3. Select OK.
Adams View undisplays and the Adams Insight window opens.
To view your simulation results:
■In the treeview, under Design, select Work Space.
Simulation results from Adams View appear in the design matrix as shown in Figure 25.
■In the treeview, under Design, select Work Space Review.
The Work Space Review offers another means of reviewing the raw data found in the work space.
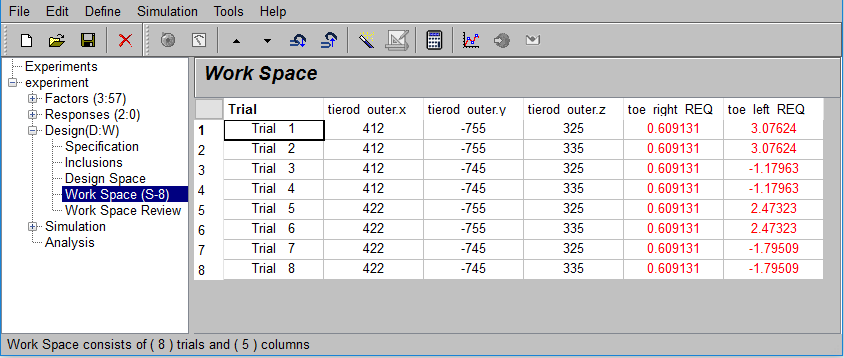
Figure 25 Work Space Matrix After Running Trials in Adams View
Fitting Results
Now that Adams View has completed the trials defined in your work space matrix, you can use Adams Insight to fit your results to a polynomial or a response surface. The purpose of fitting your results is to establish a relationship between the factors and responses that you selected for the work space matrix. Fitting results includes a multiple regression. You will be able to investigate the parts of the regression in the Summary (located in the treeview under Analysis) after completing the following steps. For more information on this topic, refer to the Adams Insight online help.
To fit your results:
1. From the Adams Insight toolbar, select the Fit results tool  . You can also select the Tools menu, and then select Fit New Model.
. You can also select the Tools menu, and then select Fit New Model.The Model Properties Summary window appears. Here, you can enter information on your model.
2. In the Regression column, select the response, toe_right_REQ.
3. In the Display column, select the type of results you want to view. For example, Figure 26 shows an example of the Fit table.
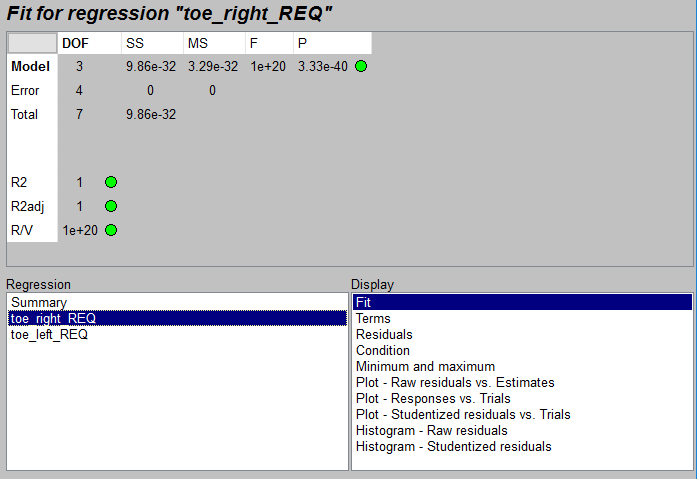
Figure 26 Results Table with Fit for Regression
For definitions of the items in the results tables, refer to the online help.
The tables also provide you with a color code that indicates the soundness of your results:
 Green indicates that all fit criteria meet or exceed highest fitting thresholds
 Yellow indicates that the fit criterion may bear investigation
 Red indicates that the fit criterion should be investigated
To review the fit:
Here is a suggested list of steps that you can use to view and modify the fit. For more information on evaluating the fit, refer to Evaluating the Fit in the Adams Insight online help.
1. Check R2 and interpret the ANOVA table.
♦Verify residuals
♦Remove outliers, if any
♦Remove terms, if necessary
2. Check R2 and interpret the ANOVA table.
♦Transform response, if necessary
♦Change model order, if needed
3. Check R2 and interpret the ANOVA table.
4. Monitor error DOF in the fit display.
As you attempt these suggestions, go back through the following steps:
Optimizing Results
You can perform single-objective and multi-objective optimization using Adams Insight. Single-objective optimization involves trying to achieve a target for one scalar response; multi-objective optimization involves more than one scalar response.
You can optimize your results by:
Updating Factor Settings
Here you will learn how to optimize your model by changing factors.
To optimize your model by changing factors:
1. From the Tools menu, select Optimize Model  .
.
.The window displays your model’s factors and responses (design objectives). Only scalar responses are shown in the window. Composite responses are not displayed.
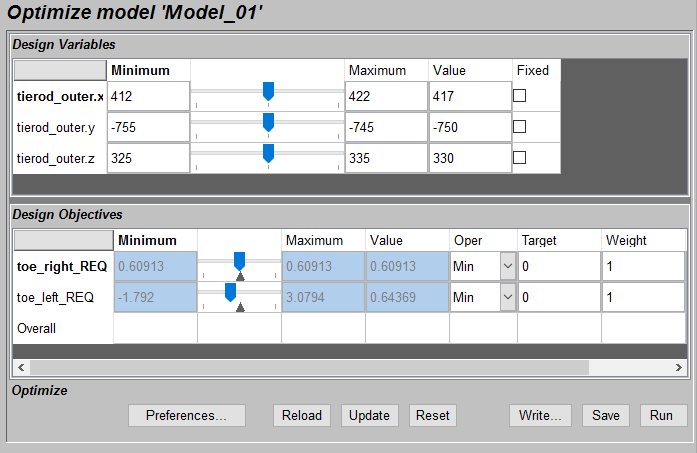
Figure 27 Optimization Window
2. Modify the current value of one or more factors.
To change the values, use the sliders next to each factor, or enter new values in the corresponding Value text boxes.
3. Press Update.
Adams Insight updates the responses to reflect the changes you made to the factors. Use the Reset button to return to the nominal values for each factor. Use Reload to reload all of the optimization settings.
Note: | To save your results, select Write and enter the name of the file to which you want to save. You can save to a number of different formats, including a .cmd file, which can then be read back into Adams View to set the model using the specified factor settings. |
Updating Design Objective (Response) Settings
Here you will learn how to optimize your model by changing design objectives (responses).
To optimize your model by changing design objectives:
1. Modify the response values as appropriate. You can change the following values:
■Oper: Changes the operator.
■Target: Changes the target value for the response.
■Weight: Applies a higher priority in achieving optimization for that response. Weight values can range from 0.0 to 1.0, where 1.0 indicates greater importance.
Note: | The  in the slider area identifies the current value. in the slider area identifies the current value. |
2. Select Fixed next to any factor that you don’t want changed during the optimization.
3. Press Run.
Adams Insight updates the factor values to reflect the changes you made to the responses. Use the Reload button to return to the nominal values for each factor/response.
Note: | To save your results to a text file, select Write and enter the name of the file and file type to which you want to save. |
Publishing Results
Adams Insight lets you save your results in .html, .slk, .bas (Visual Basic), and .m (MATLAB) formats. Once saved, you can use other utilities, such as a browser or spreadsheet program, to modify factors and see the effect on responses without performing full simulations.
To publish your results:
1. In the treeview, under Analysis, select Model_01, and then go to the Adams Insight toolbar, and select the Export to Web, SLK, etc. tool  . You can also select the File menu, point to Export, and then select Model. In the window that opens, set the File Type to HTML File.
. You can also select the File menu, point to Export, and then select Model. In the window that opens, set the File Type to HTML File. 2. The Save dialog box appears and prompts you to save your results as xxx.htm, where xxx is the name of your file.
3. Enter a name for your file and specify the path where you would like it to reside, and then select Save.
Adams Insight saves your file in the directory that you specified.
4. Continue with the next section, Modifying Values Using a Web Browser, to learn how to view and use the results in the HTML file.
Modifying Values Using a Web Browser
Using the HTML page that you saved (see 1. through 3. above), you can modify the input factor values of your experiment and see the changes instantly reflected in the column that lists estimated responses. To learn more about making modifications to your experiment using an HTML or SYLK page, refer to the Adams Insight online help.
To modify your factors in an HTML page:
1. If not already displayed, display the Report toolbar by right-clicking a blank space in the toolbar area, and then selecting Report.
2. Select the Display last exported item tool  .
.
.Your default browser opens the HTML page you created for your experiment. Make sure the browser you use is able to read JavaScript.
The results of your experiment appear as shown in Figure 28.
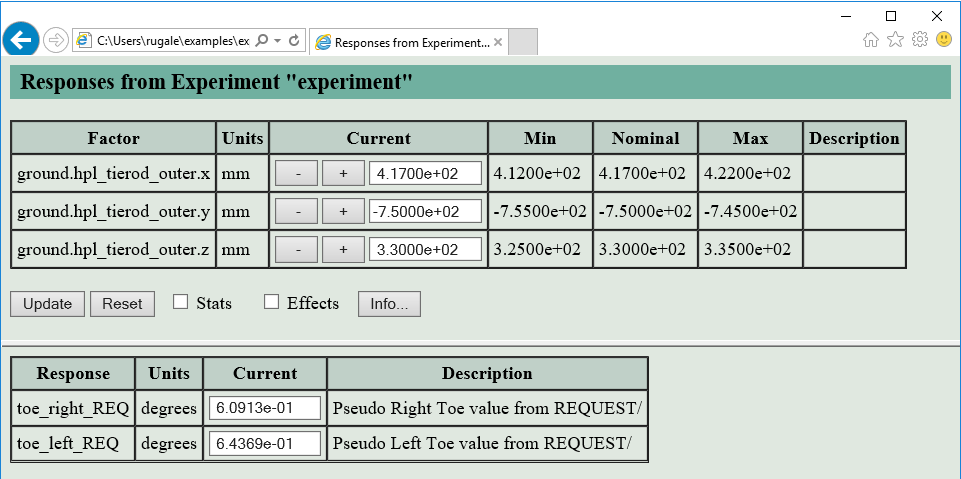
Figure 28 HTML Page of Results
3. Change the value for the first factor hpl_tierod_outer.x from 417 to 420, and then select Update.
The estimated responses adjust to reflect the new factor values. Notice that the value for only one of the responses, toe_left_REQ, reflects a change. Because the Adams model you’re working with is an independent suspension, in which the right tie rod is not coupled with the left tie rod, the changes in the factor values you made only affect the left side of the suspension.
4. You can continue to vary the factor values and investigate how changes to them affect your responses. To learn more about analyzing the results of your experiment and publishing your results to HTML or SYLK pages, refer to the Adams Insight online help.
5. Close your browser window.
6. Exit Adams Insight.
7. Exit Adams View.
Additional Information on the Web Page
In addition to the basic factor and response information that appears when you first open the HTML file in your Web browser, you can view response statistics and response effects as a function of each factor. To view this information, use the check boxes below the list of factors. The check boxes are:
■Contributions - This check box appears if you specified a non-zero tolerance for any factor. When present and selected, this check box displays the Tolerance Contributions table that provides the percent contribution of each factor to the tolerance of each response.
■Stats - Displays R2, R2 adjusted, P, and R/V statistics for each response.
■Effects - For each response, displays effects caused by varying each factor from its minimum to maximum value.
■Nonscalar - Displays composite responses in addition to the scalar responses.
■Plots- Opens a new window that displays a plot for each composite response (providing you specified composite responses).
■Info - This button displays a separate window that provides summary information about the DOE parameters for the current page. It also provides Web environment information that is valuable if you need to contact Adams technical support.
For more information on the controls and information provided by the HTML page, refer to the Adams Insight online help.