Controlling the Display of Two-Dimensional Plots
For two-dimensional plots, you can control the following:
Zooming In on a Plot
You can define the area of a plot that you want enlarged and displayed in the current window. You draw a box to define the zoom area.
Note: | You can also zoom in on an area of a plot by setting the minimum and maximum values to be displayed on the plot axes. Learn about modifying axis attributes. |
To define a zoom box:
1. On the View menu, select Zoom Plot.
2. Place the cursor where you want the upper right corner of the box and click and hold down the left mouse button.
3. Drag the mouse diagonally to define the size of the box.
4. Release the mouse button.
Tip: | Either: ■Click and hold down the middle mouse button when the cursor is in the window and drag the mouse to define a zoom box. |
To Pan Within a Plot
a. Zoom in on a section of the plot via the area-zoom button (or via the newly-added keyboard shortcut “w”) 
b. Once the plot is zoomed, use the left/right and up/down arrow keys on the keyboard to pan within the plot
c. Alternatively, do a dynamic pan using the new pan button (or via the keyboard shortcut “p”). Press the “Esc” key to exit pan mode.
d. Plot can be re-fit to its entire extent by clicking the fit button (or via the newly-added keyboard shortcut “f”)
To Copy to Clipboard
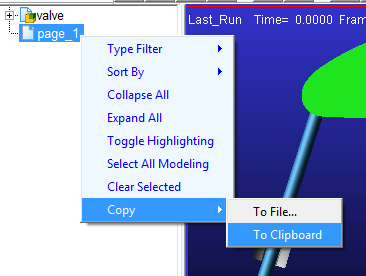
a. To copy the contents of the entire page, right-click the page from the treeview and select “Copy - To Clipboard”. Both the animation pane and the plot pane can now be pasted as a single image into Word® or PowerPoint® (for example) by those applications’ “Paste” buttons or via Ctrl+V.
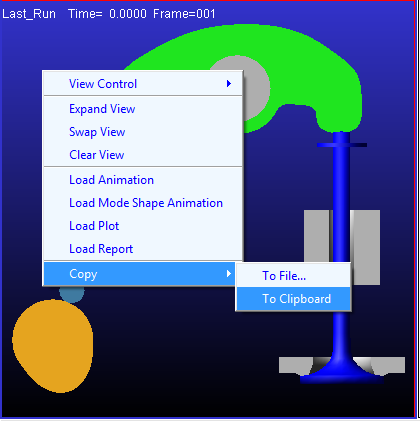
b. To copy the contents of an individual pane, select that pane by clicking in it and then right-click in empty space on the given pane and select “Copy - To Clipboard” (or use keyboard shortcut Ctrl+C). The content of that particular pane can now be pasted as a single image into Word® or PowerPoint® (for example) by those applications’ “Paste” buttons or via Ctrl+V.
Fitting a Curve to a Two-Dimensional Plot
You can scale all the curves on a plot so that they fit entirely within a viewport.
To fit curves to a plot:
■From the View menu, select Fit Plot.
Tip: | Either: ■Click and hold down the middle mouse button when the cursor is in the window and drag the mouse to define a zoom box. |
Setting Up Two-Dimensional Plot Parameters
The following figure shows some of the plot parameters that you can set for a 2D plot. See Listing of Plot Parameters.
Learn more about them and how to set them up:
Plot Parameters
Note: | You can also set up pages so that they have headers and footers. For more information, see Displaying Headers and Footers on Pages. |
Modifying Titles and Axis Placement
To set plot parameters for title, subtitle, and axis placement:
1. Select a plot.
3. Set the title and subtitle:
■To have Adams PostProcessor automatically generate titles and subtitles, select Auto Title or Auto Subtitle.
■To create your own titles and subtitles, clear the selection of Auto Title or Auto Subtitle, and in the Title and Subtitle boxes, enter the text for the title and subtitle. The title and subtitle can only be a single line of text. Learn how to modify the text and have multi-line titles.
4. To have the analysis name and the date on which the analysis was generated appear on the plot, select Analysis and Date Stamp.
6. To create a line at the position 0,0, select Zero Line.
7. Set where you want the dependent axis of data to appear by selecting either Horizontal (along the x-axis) or Vertical (along the y-axis). Note that you can only change the orientation if there are no curves on the plot.
Modifying Plot Borders
To modify a plot border:
1. Select a plot.
3. Set Color to the color for the border.
4. Select the type of line style and weight for the border. The weight values range from 1 to 5 screen pixels.
5. Set up the placement of the plot:
■To center the plot in the viewport and keep it centered even when you make modifications to its layout, select Auto Fit Border.
■To set your own margins for the plot, clear the selection of Auto Fit Border and enter the minimum and maximum values for the margin in the x and y directions in pixels. See the figure below for assistance.
Min X - Sets the space from the left edge of the window to the left edge of the plot.
Max X - Sets the width of the plot. It includes the left margin that Min X defines.
Min Y - Sets the size of the space from the bottom edge of the window to the bottom edge of the plot.
Max Y - Sets the height of the plot including the bottom margin that Min Y defines.
Minimum and Maximum Values for Borders
Modifying Primary and Secondary Grids
Adams PostProcessor displays grids on a plot to provide visual guides for inspecting curves. You can have primary and secondary grid lines. Primary grid lines appear at all major unit sections. Secondary grid lines appear at specified intervals between the primary grid lines. If you turn off the primary grid lines, Adams PostProcessor also turns off the secondary grid lines.
To modify the properties for the primary or secondary grid:
1. Select a plot.
3. To turn off the display of the grid, clear the selection of Visible.
4. From the pull-down menu, set the number of lines by either selecting:
■Line Count and entering the number of lines in the grid.
■Increment and entering the amount of space between each grid line in the x and y directions. Enter the values in length units.
5. Select a line style, weight, and color for the primary grid. The weight values range from 1 to 5 screen pixels.